Hundreds of Years of Data Growing on Trees
While data visualization can seem like a modern design focus, it really has its roots in the High Middle Ages when a sudden rise in information and population resulted in the need to convey ideas in an accessible way.

While data visualization can seem like a modern design focus, it really has its roots in the High Middle Ages when a sudden rise in information and population resulted in the need to convey ideas in an accessible way. One of the innovations was the tree diagram. Now for the first time this often overlooked icon of information has its own in-depth historical book.
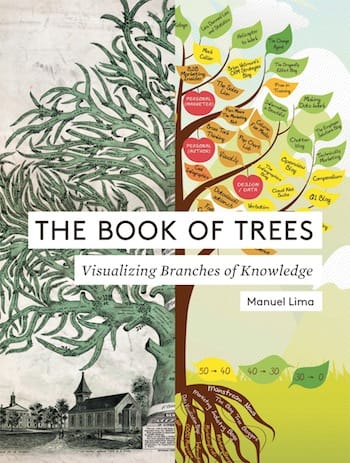
The Book of Trees: Visualizing Branches of Knowledge by Manuel Lima, out this month from Princeton Architectural Press, covers the centuries of the tree diagram’s growth from religious and moral guide to computer science utilization. The book is something of a companion to Lima’s 2011 Visual Complexity, in which the data designer and expert explored the broader history of information visualization.
“Given the recent surge of interest in the field, it’s tempting to contemplate information visualization as an entirely new discipline rising to meet the demands of the 21st century,” Lima writes in his introduction. “But, as with any domain of knowledge, visualization is built on a prolonged succession of efforts and events, the evidence of which has in many cases been lost or scattered in dark, dusty cabinets.”
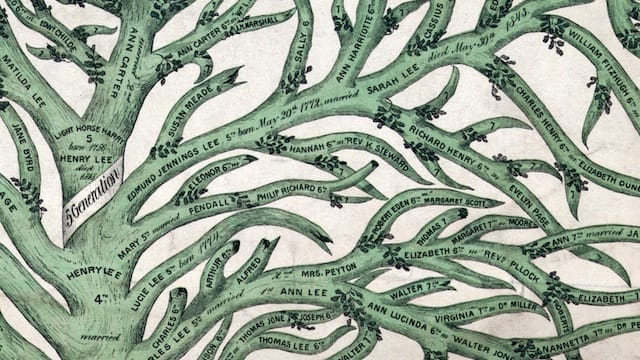
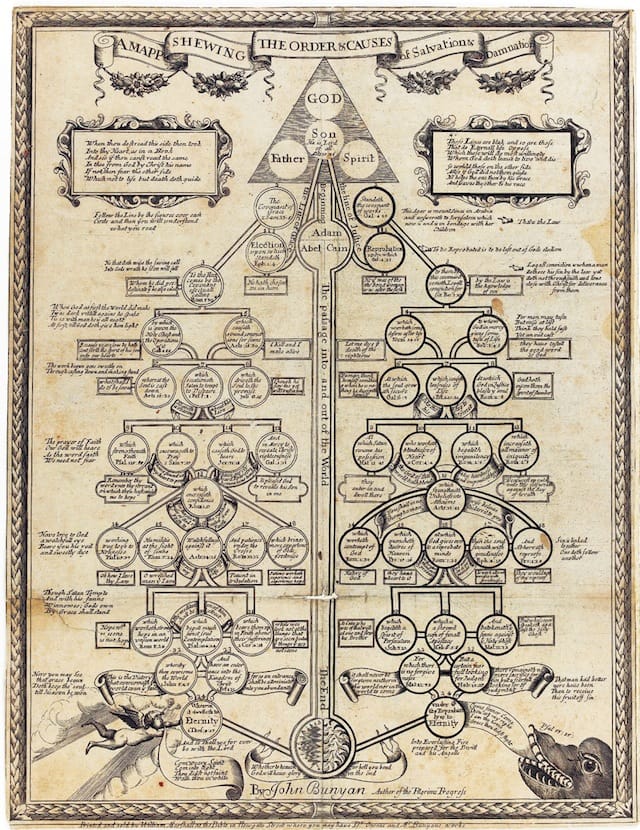
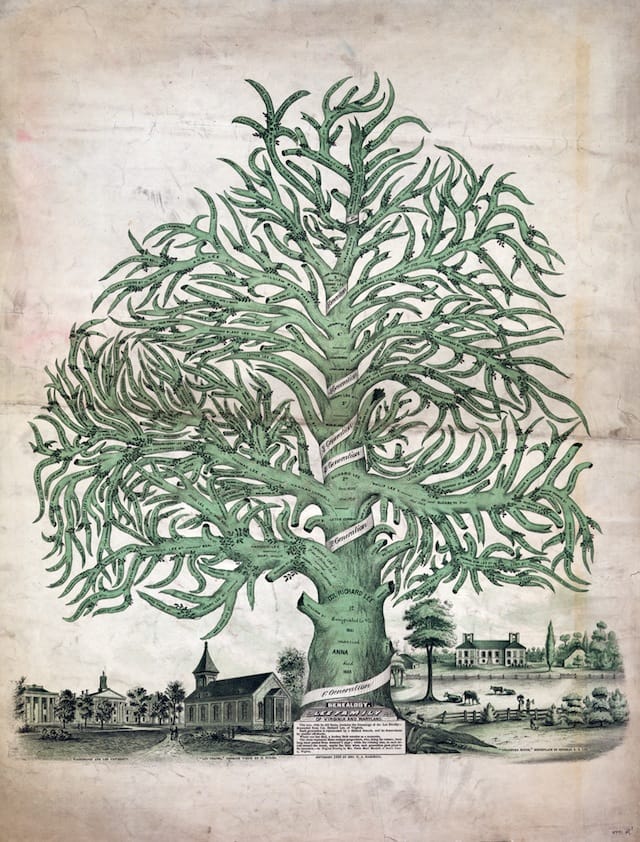
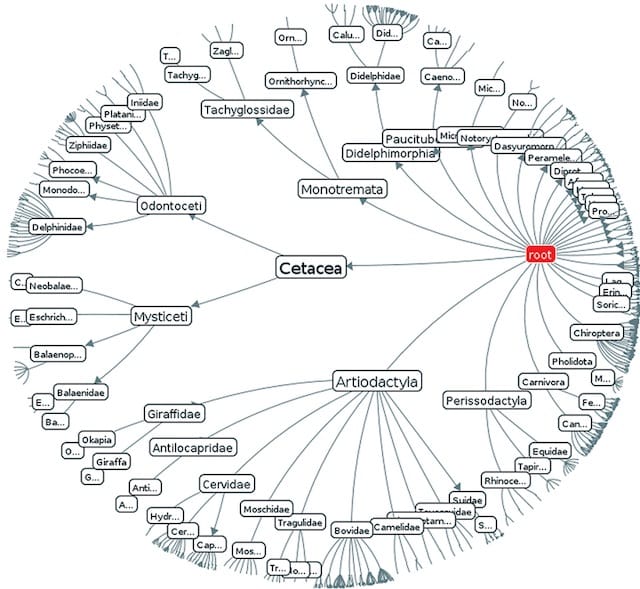
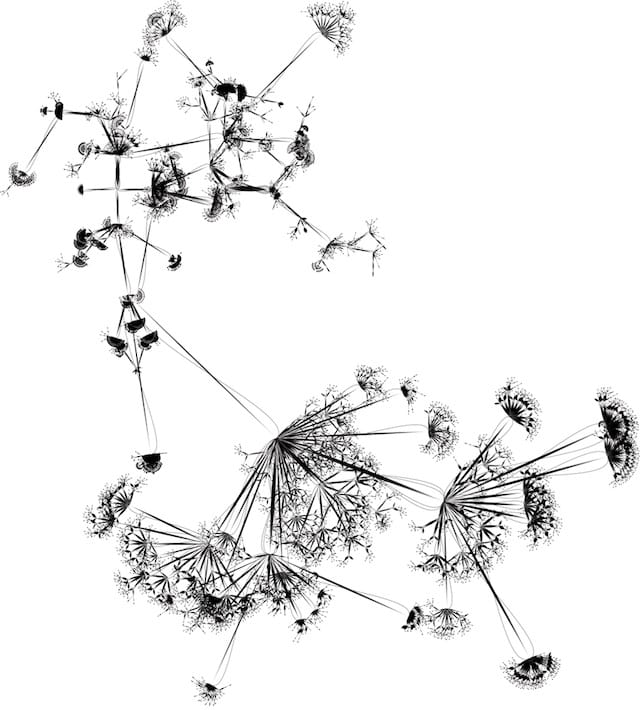
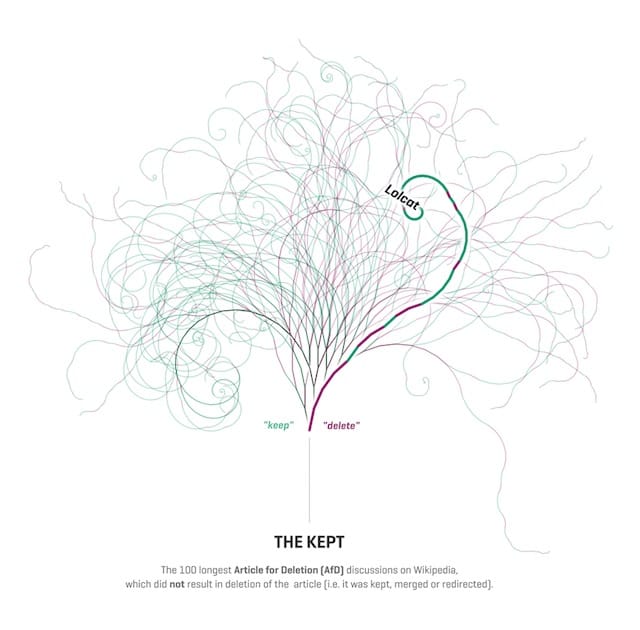
The title of the book is a bit misleading, as much of what it contains doesn’t look arboreal at all. As the figurative tree diagram progressed into more pragmatic uses it abstracted, such as with the staggered lines of vertical tree diagrams like you might use to plot your family tree, or the much more conceptual icicle trees from the early 1980s that use a succession of rectangles to express hierarchy. Yet Lima argues that the heritage of even these most recent graphs is in the botanical tree itself:
Throughout human history, the tree structure has been used to explain almost every facet of life: from consanguinity ties to cardinal virtues, systems of law to domains of science, biological associations to database systems. It has been such a successful model for graphically displaying relationships because it pragmatically expresses the materialization of multiplicity (represented by its succession of boughs, branches, twigs, and leaves) out of unity (its central foundation trunk, which is in turn connected to a common root, source, or origin).
Lima starts way back in ancient times with dendrolatry — the veneration of trees. From carvings of sacred trees in Assyrian reliefs, to the Canaanites with the Asherah pole, to the Judaic Kabbalah tree, each culture and religion seems to have some spiritual connection to it. So perhaps it makes sense people would use that familiar form with its easily depicted shape as one of the first ways to structure hierarchical information.
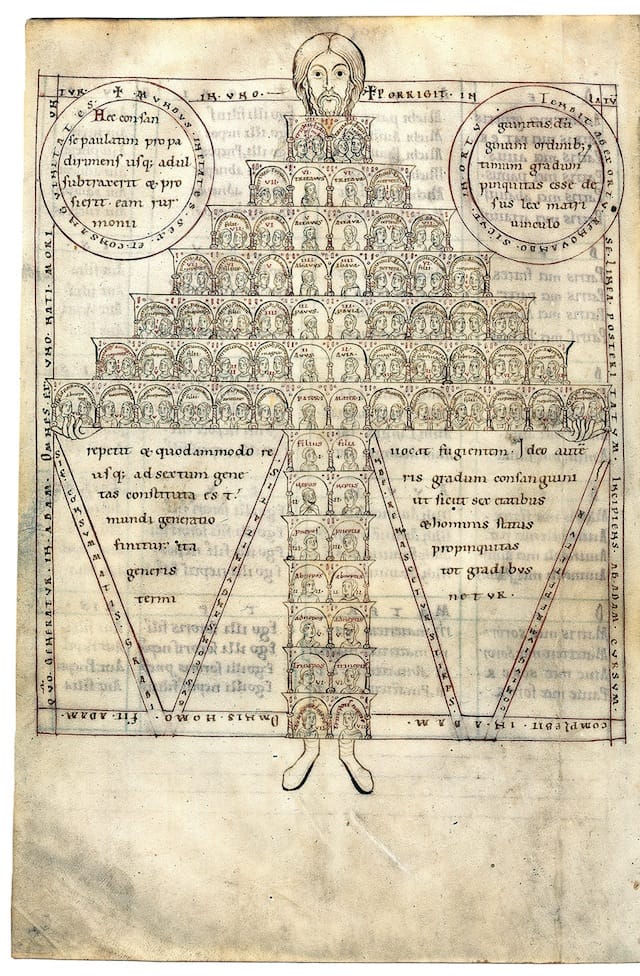
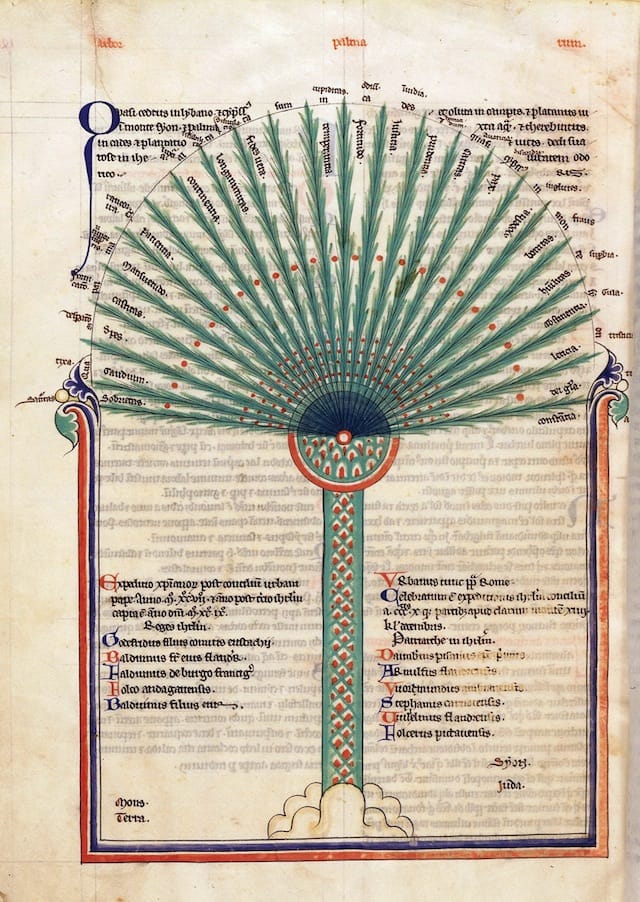
While trees themselves are inarguably an enduring symbol, Lima places their flourishing into data visualization from 1000 to 1300 CE. Trees of “consanguinity” showing connections of blood both royal and religious sprouted up all over Europe. They were also useful in explaining complicated rulings and decrees, with one for Pope Clement V stating in Latin above its branches: “Since the matter of this title is too intricate, difficult, and quotidian: it might be easier to comprehend using the figurative art of a trunk.”
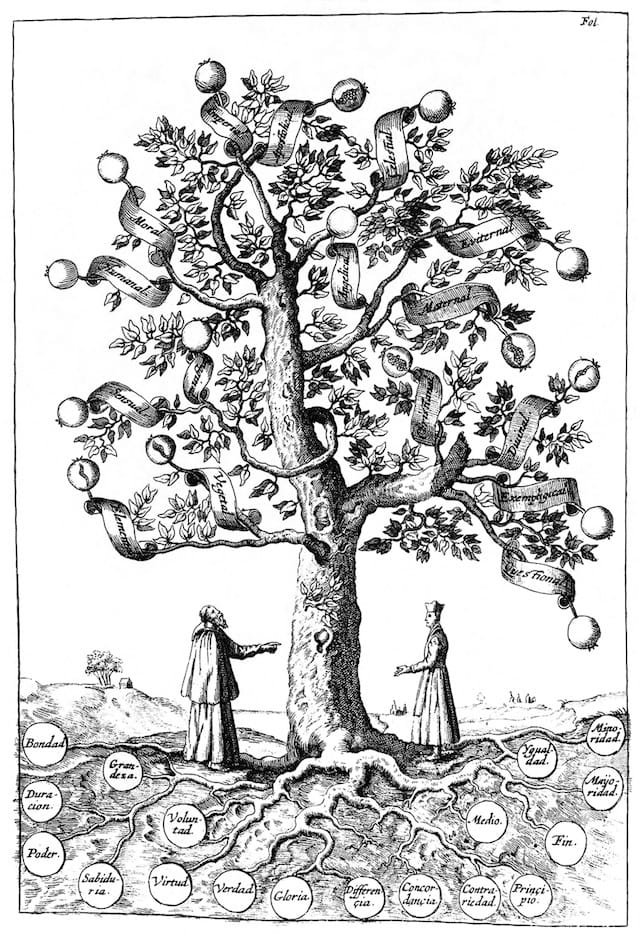
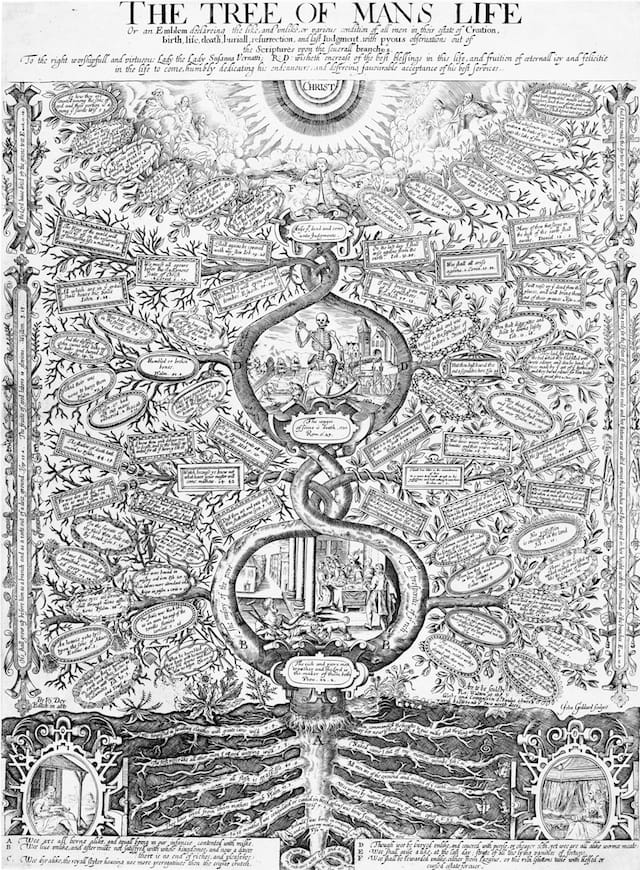
In the 12th century, another tree appeared: the tree of morality showing branches of right and wrong. Then in the 13th century a Spanish scholar named Ramon Llull arranged 16 areas of science into a tree, an idea that endured so strongly that a tree of science and knowledge was used as the frontispiece in Denis Diderot and Jean le Rond d’Alembert’s 1780 Encyclopédie. Later Darwin would use a “Tree of Life” to show evolutionary thinking. Even if you might not be familiar with these examples, words like “branches” of science and “roots” of problems are still embedded in the lexicon.
There are 200 examples of tree diagrams in The Book of Trees, the small forest of diversity a good argument for their proliferation in visualizing data. (It’s too bad the book does not include a tree diagram of the development of tree diagrams.) As Lima writes, these trees “make the invisible visible,” and as with all data visualization, where art and science meet there can be compelling designs in communication.
The Book of Trees: Visualizing Branches of Knowledge by Manuel Lima is available April 15 from Princeton Architectural Press. Lima will be at the Strand (828 Broadway, Manhattan) on April 24 and the 92nd Street Y on May 21 for book talks.