
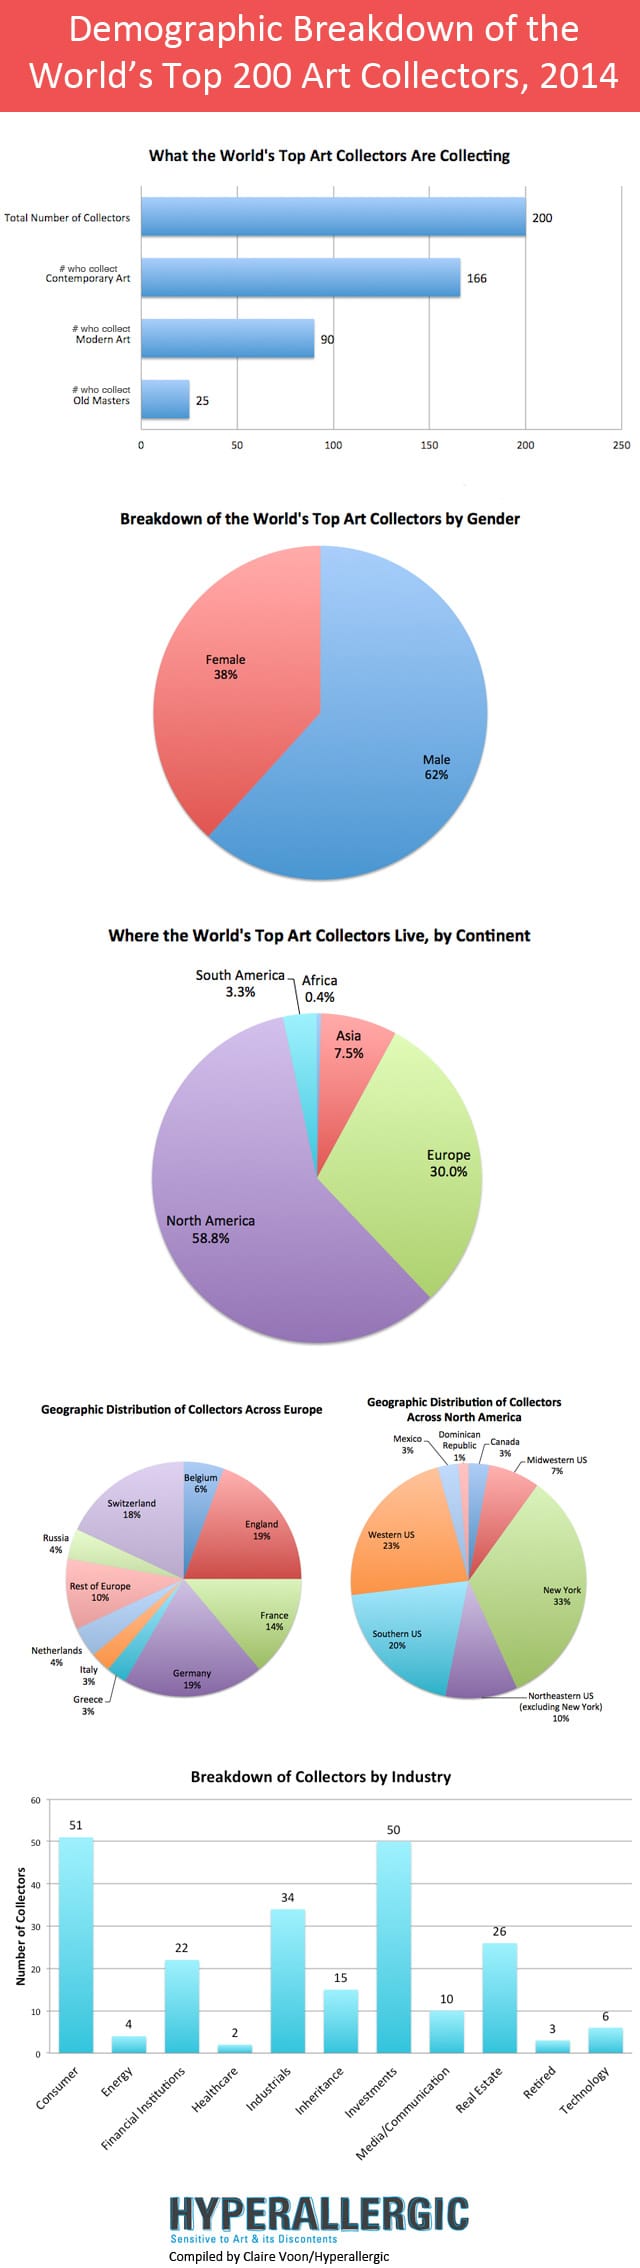
Last week, ARTnews Magazine published its annual list of the 200 “top” (read ‘most active’) art collectors around the world, recording the types of art the buyers collect, where they reside, and the industries in which they work.
Hyperallergic has taken it on ourselves to crunch the numbers and scan the demographics of this influential group that has sway on the art market. As expected, contemporary art remains the most popular among collectors, men dominate the art collecting scene, and a vast majority of these collectors live in North America and Europe (and none in Australia!).
We should mention some points of interest in our methodology. We counted heterosexual couples individually (one male + one female, and there were no LGBT couples on the list), and we did not count the one family (Grässlin) in order not to skew the numbers. Numbers do not always add up to 200, as many collectors collect various types of art and work in multiple fields.

The low numbers of collectors in tech industry reflect everything I have read about that sector’s relationship to art.
Remember this is only the top 200, I think there are probably a lot of tech buyers but they don’t spend money on art the same way financiers do. Maybe if we looked at the top 500 significantly more tech buyers would emerge.
That is sooooo true. I live in Austin, Texas, and unfortunately, software engineers have no interest or desire to learn about art (unless you put a microship in it).
This is premature. It takes time to develop an appreciation for art. Plus, as you get older, you become more sedentary and thus desire more sedentary things. Check back in 25 years when those 30 year old techies are closer to their golden years. They’ll begin to represent a larger share of the art market.
To be clear, The Art News 200 Top Collectors list is not exactly the most accurate, up-to-date listing of the most important collectors worldwide…. so take it all with a (biiiiiig) grain of salt…
True, but every list is skewed based on politics, etc., no?
Hrag: To be sure! But in this case I am clarifying that Art News’ list is simply akin to the portion of the iceberg that is visible above the surface of the water. They don’t see the portion that floats under the water. It’s not so much an issue of politics as it is one of visibility and discretion. This list would look radically different if they were privy to better, more granular intel and recon… t
We’ve changed a few things. Hope this helps.
no worries – hey – you didn’t make the list in the first place!
There’s some technical mistakes with these charts:
1. The first graph shouldn’t have a “TOTAL NUMBER OF COLLECTORS” as a table entry. It should somehow be labelled in the x-axis. If it’s a bar entry, then it conflicts with other y-axis categories. Total number of collectors is not a hierarchally comparable category as “Contemporary Art.” So, you wonder what the numbers actually mean? Are they actual purchases of artworks? It’s confusing.
2. Pie charts by their nature, and the fact that you’re using percentages, always imply they add up to 100%. Therefore there no need to actually say, “Numbers do not add up to 200”
Yes, #2 was an error. For #1 we wanted to give a visual comparison for easy comprehension. The numbers are number of collectors that buy in that category.