Looking for a Job in the Arts? Try North Dakota, New Study Suggests
A new report by the National Endowment for the Arts and the Bureau of Economic Analysis (BEA) of the US Department of Commerce tracks the economic impact of the arts nationally and state by state.
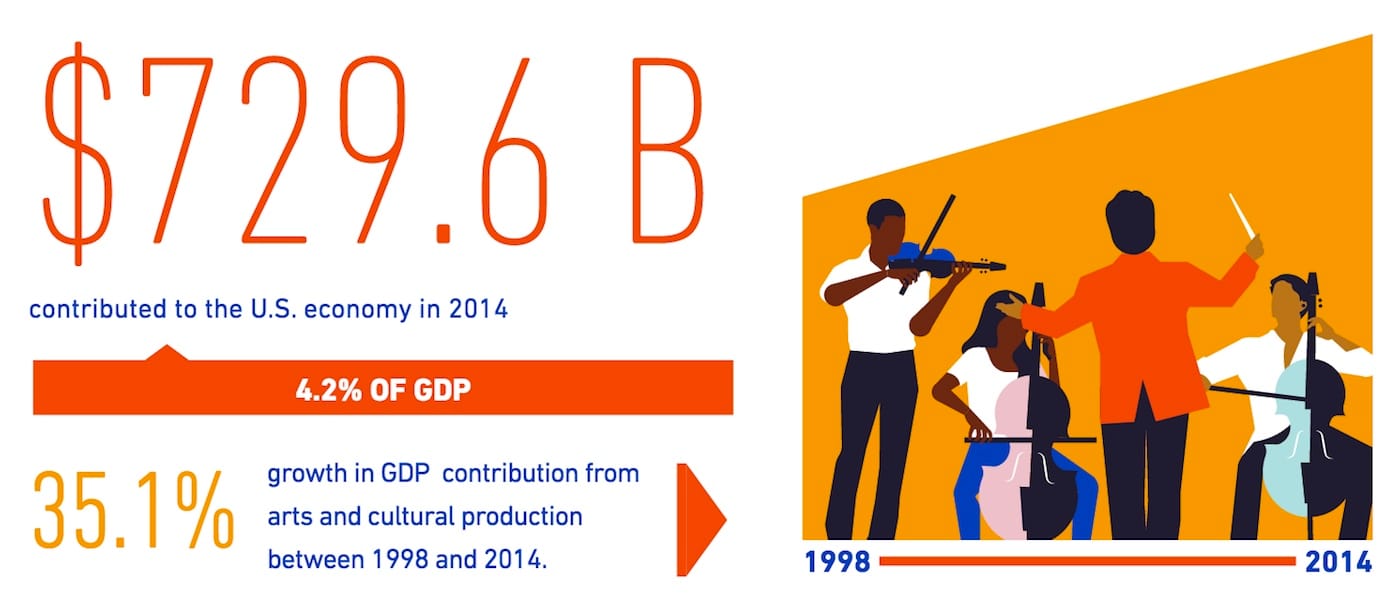
On Wednesday, the National Endowment for the Arts (NEA) released a report charting the economic impact of the arts both federally and at the state level, revealing surprising information about how region-specific cultural industries generate jobs and funds. The research, conducted by the NEA and the Bureau of Economic Analysis (BEA) of the US Department of Commerce, is based on data from 2014 pertaining to jobs in the Arts and Cultural Production Satellite Account (ACPSA), which “measures the number of workers employed to produce arts and cultural goods and services” across all industries. These figures show that the arts and cultural sector contributed $729.6 billion to the US economy in 2014, or 4.2% of the gross domestic product (GDP).
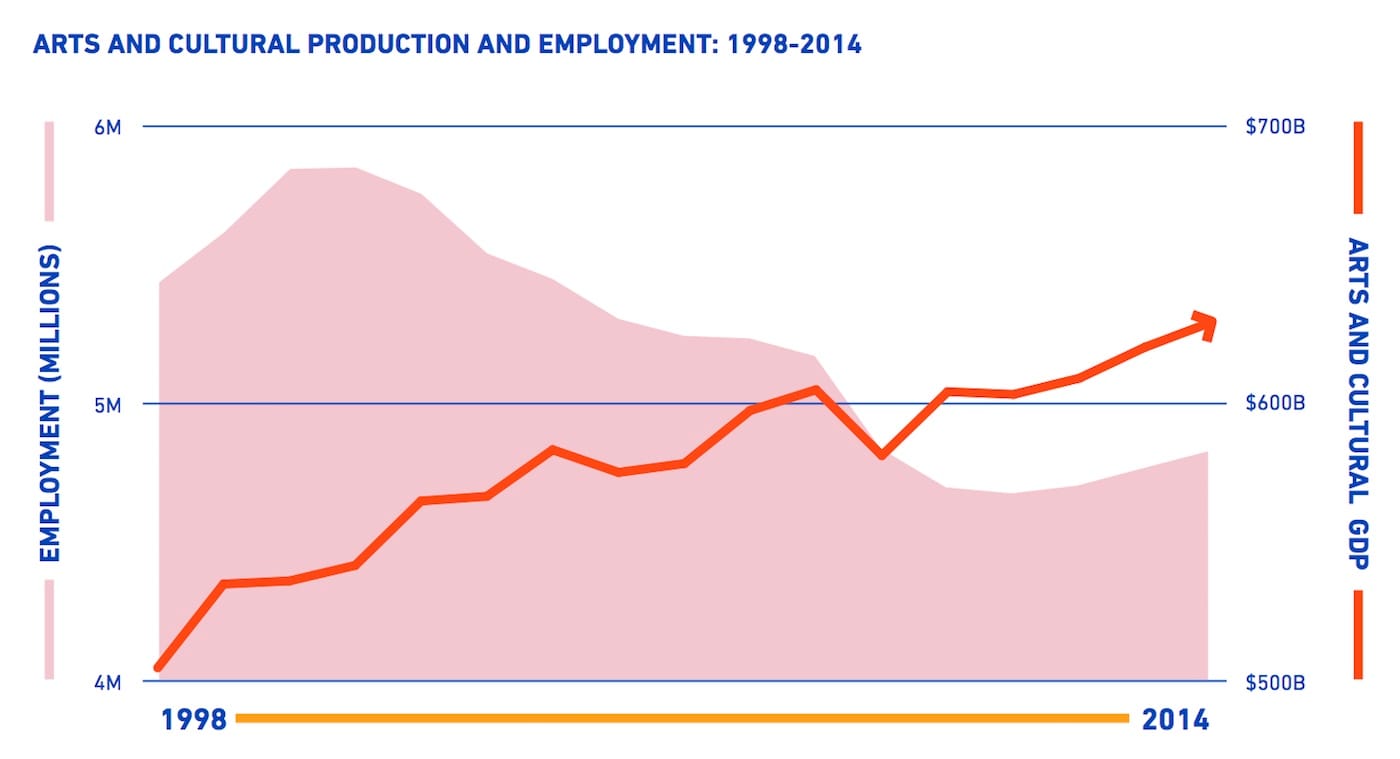
The report comes at a time when the very existence of the NEA is threatened by President Trump, and making the case for the economic impact of the arts could be seen as a means of convincing him and other Republican politicians that government funding for culture pays off. For instance, the report shows that arts and culture’s share of the GDP is growing slightly, up 1.4% from 2012 to 2014. The report is also broken down by sections of the culture industry: museums, for instance, contributed $5 billion in arts and cultural goods to the GDP in 2014, representing a rise of 2% since 2012; the cultural activities of fine art schools, meanwhile, contributed $3.3 billion to the national economy for a more modest growth rate of 1.8% since 2012. The cultural sector employed some 4.8 million people in the US in 2014, paying them a cumulative $355 billion in compensation. Not all the report’s findings are positive, though; for instance, employment in cultural production has fallen by about one million jobs since 2000–01, when it peaked at about 5.8 million.
What may be most useful about the report, however, is its level of state-specific detail. These figures reveal, for instance, that in 2014 the states of New York, Washington, and Wyoming had the highest concentrations of arts and cultural employment (47%, 30%, and 28% above the national average, respectively). The data gets even more specific when one looks specifically at jobs in the museums category (which, per the peculiarities of the ACPSA metric, also includes planetariums, sports halls of fame, historical sites, zoos, botanical gardens, and nature sanctuaries). In 2014, the highest concentration of jobs in museums and similar institutions was in Hawaii, where the sector employed more than 2,500 people — representing a share of the state’s workforce that’s 4.5 times larger than the national average.
The data also supports the kinds of regional specializations you might expect. Cirque du Soleil probably has something to do with the fact that people working for performing arts companies in Nevada are better compensated than their colleagues in any other state, earning four times the national average. And the music industry in Memphis likely plays a role in Tennessee having the second-highest compensation rate for performing arts work, 3.5 times the national average. California and New York dominate employment in film and video production, with the percentage of workers in the industry compared to total state employment being more than three times higher in the former and 2.3 times higher in the latter.
By comparing the 2014 data with previous years’ figures, the report also maps recent trends in the arts and culture sector state by state. The number of workers employed in arts and cultural production dropped by 1% or more in a whopping 45 states and Washington, DC, between 2008 and 2014 — Rhode Island experienced the steepest drop, losing 20% of its arts and culture production jobs. The arts employment rate remained relatively steady in Texas and New York in those years, while three states experienced exceptional growth in cultural employment: In North Dakota, Utah, and Washington, arts and culture employment went up by almost 11%, 7%, and 5%, respectively. Still, North Dakota’s total of 13,764 jobs in the culture sector in 2014 are a drop in the bucket compared to California’s 674,865 — the most of any state.
The NEA and BEA report’s many maps, data profiles, interactive infographics, fact sheets, and more provide a vast trove of evidence for the enormous economic benefits of a thriving culture industry.