NASA Captures the Motion of the Ocean
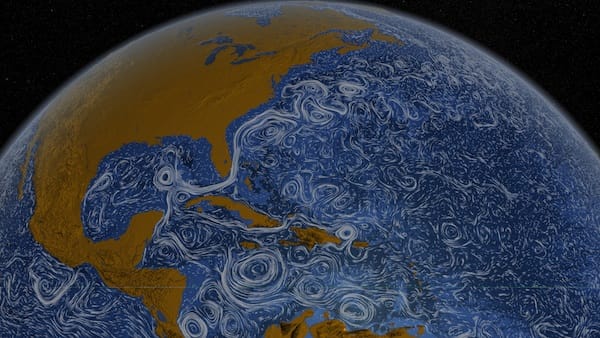
LOS ANGELES — These visualizations out of NASA's Scientific Visualization Studio, dubbed Perpetual Ocean, show the currents of the oceans.

LOS ANGELES — Just last week, I looked at HINT.FM’s gorgeous wind mapping project. The wind, as we all know, is deeply intertwined the world over. But so is water. And in many ways, trying to imagine all the chugging waves around the world as related to each other is more mind boggling than the wind.
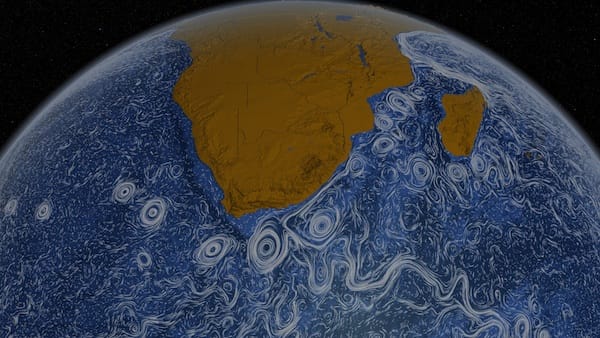
These visualizations out of NASA’s Scientific Visualization Studio, dubbed Perpetual Ocean, show the currents of the oceans. Unlike the wind, the water is often subject to gorgeous curls and twists, and you can visually see the chaos that you can feel any time you go boating on the open ocean. You can also see the very same long currents that might have taken Ferdinand Magellan or Zheng He on their global explorations. Here’s NASA’s helpful description of what you’re looking at:
ECCO2 [Estimating the Circulation and Climate of the Ocean, Phase II] provides ocean flows at all depths, but only surface flows are used in this visualization. The dark patterns under the ocean represent the undersea bathymetry. Topographic land exaggeration is 20x and bathymetric exaggeration is 40x.
Yes, I had to look it up too. Bathymetry is the study of ocean depth, so the darker spots mean a deeper ocean.
NASA’s gone old school, with downloadable QuickTime files rather than YouTube or Vimeo (Green TV has a YouTube version), but they’re well worth the download. You can also view them on their Visualization Explorer iPad app. Next time you consider sending a message in a bottle, you can now research where that bottle is most likely to end up.