The Arts Vibrancy Index heat map (courtesy SMU’s National Center for Arts Research)

The Arts Vibrancy Index heat map (courtesy SMU’s National Center for Arts Research)

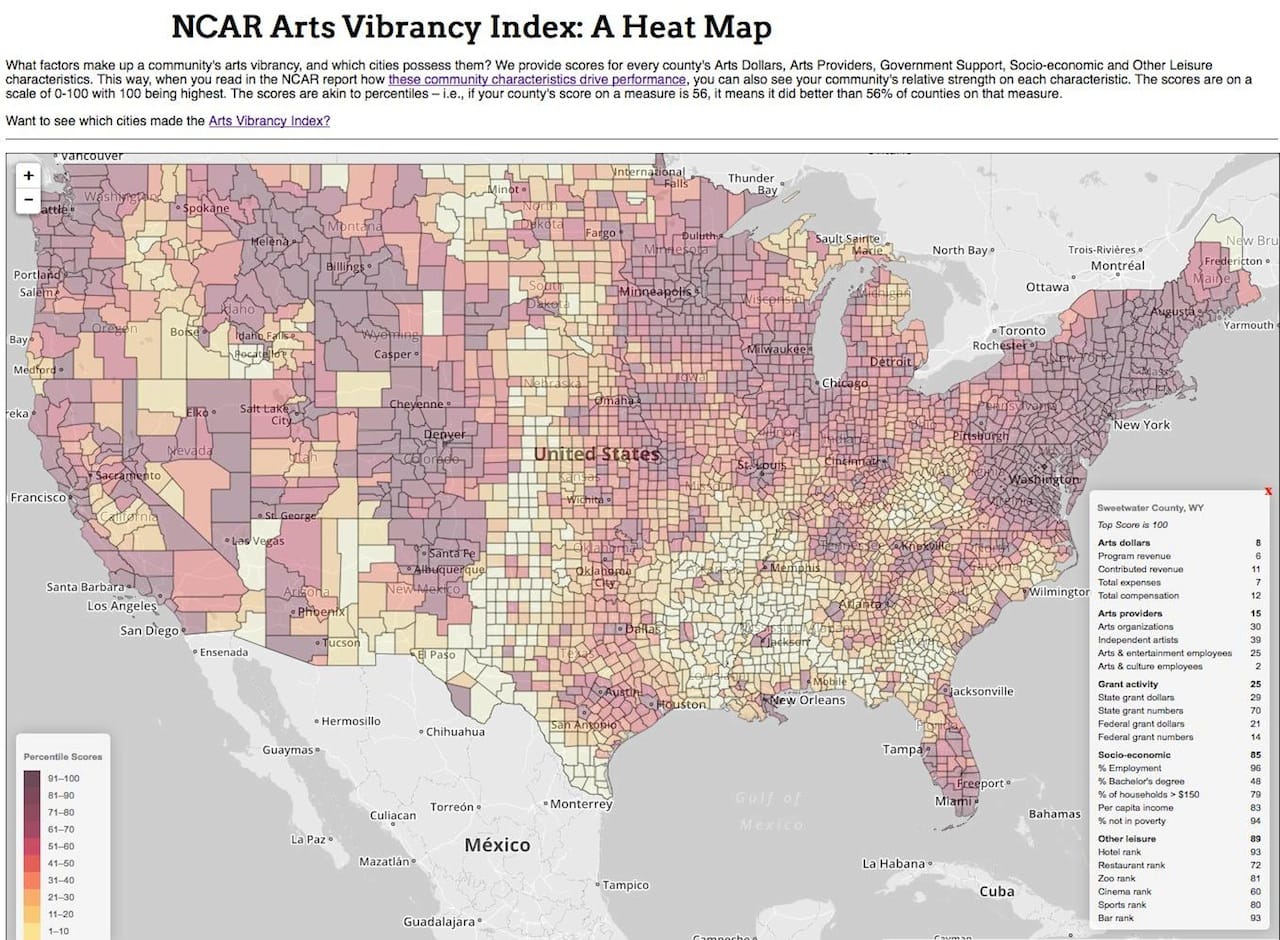
The National Center for Arts Research (NCAR) at Southern Methodist University has released its first Arts Vibrancy Index, a report that ranks the cultural vibrancy of communities across the country. The index measures vibrancy in terms of “supply, demand, and government support for arts and culture” per capita, according to the press release issued by the NCAR. The number of artists and artistic organizations in a community, the amount of nonprofit funding available for cultural events, and the value of state and federal grants for the arts are all relevant factors. The index is comprehensive, providing a ranked score for each county in the US and an interactive “heat map” depicting the greatest concentrations of art in the country.

NCAR Director Dr. Zannie Giraud Voss says the center began developing the project last spring as a way of making information about the comparative health of American arts communities available to cultural leaders. She told Hyperallergic that she hopes the index will allow communities to assess their standing relative to others, providing them with models for improvement.

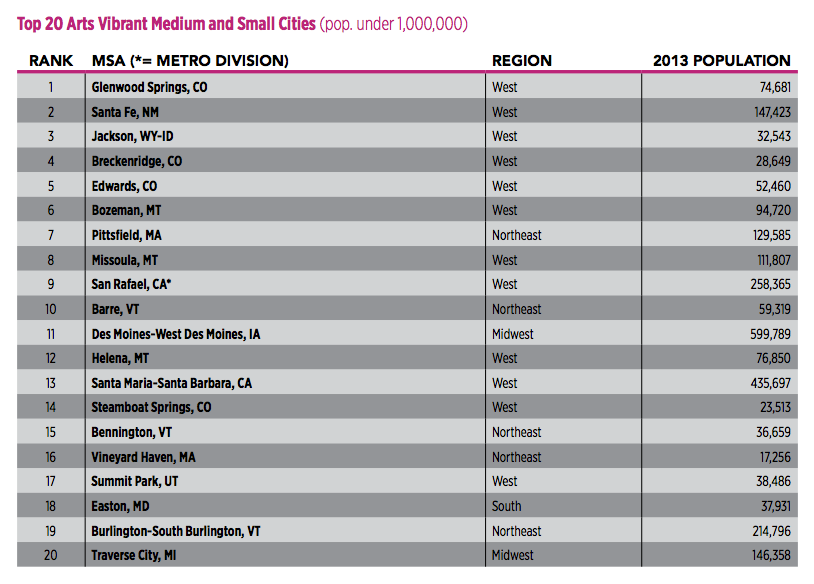
Although different cities and communities are vibrant in different ways, scoring comparatively better or worse on varying metrics, some of the likely suspects came out on top: among the highest-ranking large “markets,” defined as urban centers “with populations of 1 million or more,” are Washington DC, Nashville, New York, Boston, and San Francisco. DC tops the list because it receives so much federal funding: it ranks #1 in the “Art Dollars” category. Glenwood Springs, Colorado, and Santa Fe, New Mexico, are among the most vibrant of the smaller cities.

(image via smu.edu)

(image via smu.edu)

The Arts Vibrancy Index admits to its own limitations, acknowledging that its per-capita measurements can produce counterintuitive results and that its metrics do not reflect the quality of the art in question. The report stresses that its findings are “the start of the story, not the end.”

Hopefully, having access to quantitative data can set us up to have more informed discussions about quality, precipitating a greater conversation about what we want artistic vibrancy to look like in our communities.

Becca Rothfeld is assistant literary editor of The New Republic and a contributor to The Los Angeles Review of Books, The New York Daily News’ literary blog, The Baffler, and Slate, among other publications....

9 replies on “Arts Vibrancy Index Measures Cultural Health of Communities Across US”

  1. This just shows where the money is. I live in Boston, and I find New Orleans and Mississippi to be much more conducive to art in a way.

    1. I def would have included street art shows and free theatrical performances, and personal craft shops etc…in the data,. Maybe then the Mississippi River Delta wouldn’t look so devoid of artistic healthiness!

      1. Totally. It’s depressing to see that this research comes out of the South- and seemingly devalues the incredible art happening there because of the narrow definitions they have set for themselves. I could go on into the racial and economic biases implicit in this map, but I won’t.

        1. I agree. While supporting the arts is always a constant unfinished business in my opinion, I still personally know of many, many mom and pop craft stores along the Mississippi Gulf Coast and tons of music venues for Blues Music running the entire Mississippi Delta. I did research for an arts website into artist grants and while there were fewer community and government monies available in the deep south, there are still a lot of unknown, some successful as well as some still struggling although all very talented artists in that area!

    2. I second this. How boston made it to the “top” of this list sort of amazes me. I’m from Austin, Tx living in Boston now and to say that there is the same amount of cultural vibrancy in Boston vs Austin or even NYC is silly IMO.

  2. I agree with Katherine the Massachusetts areas show high income communities like Pittsfield, MA. In my opinion, The communities surrounding these “hot spots” is very low income and the access to seeing these shows are nearly imposible to them. People like Yo Yo Ma is who they bring to Pittsfield atractivo People from Albany, New York.

    1. Have you ever been to Pittsfield???? The median yearly income is around $40,000, at about $10,000 less than the national average, it can hardly be called “high income”. In addition, the population attributed is actually for the whole of Berkshire county, Pittsfield’s population is about 40,000.

  3. How does one get a reliable number of artists in a community, given that many artists aren’t reporting their art related income (for reasons varying from not having any to operating at a loss and not passing the “hobby” threshold)? What about all the art activity occurring off the books? How does the amount of money flowing through the nonprofit complex equate to demand from the public? Are commercial galleries and performing venues included? By throwing so many disparate metrics into one pot, the ultimate score seems so arbitrary that I’m at a loss for how it’s used to guide productive conversations about policy.

Comments are closed.