Photographs of a Melting Glacier Are Both Beautiful and Worrying
The images may be beautiful but they depict a natural world that is quickly being transformed by climate change.

When you hear (or read) the words “snow swamp” you might imagine some slushy-wet, impossible geography or, perhaps, the Magic the Gathering card —the image is unnerving either way, if not apocalyptic. The alliterative descriptor is precisely how Mauri Pelto, a glaciologist at Nichols College, referred to a rapidly-melted hillock of snow on Canada’s Lowell Glacier (it took only four days for the expanse of snow to melt), which drains east from the St. Elias Range on the Yukon-Alaska border. Pelto, who has spent 38 years monitoring the region’s glaciers, “hasn’t seen a snow swamp of this size develop this quickly ever,” as reported by Kasha Patel at NASA’s Earth Observatory. The melt took place between July 22nd and July 26th.
In a post by Pelto on the American Geophysical Union blog, he writes that the snowline had already shifted dramatically between July 4th and the 22nd; then, “just two days later the region … was under rapid transition with the snowline rising and an area of slush developing, saturated snowpack, really a ‘snow swamp.” Such accelerated ablation — the process by which snow or ice is removed from a glacier’s surface — is, Pelto explains, “due to the high temperatures,” which are higher than normal for the region in July. According to Mark Kaufman at Mashable, the Arctic is warming twice as fast as the rest of the planet.
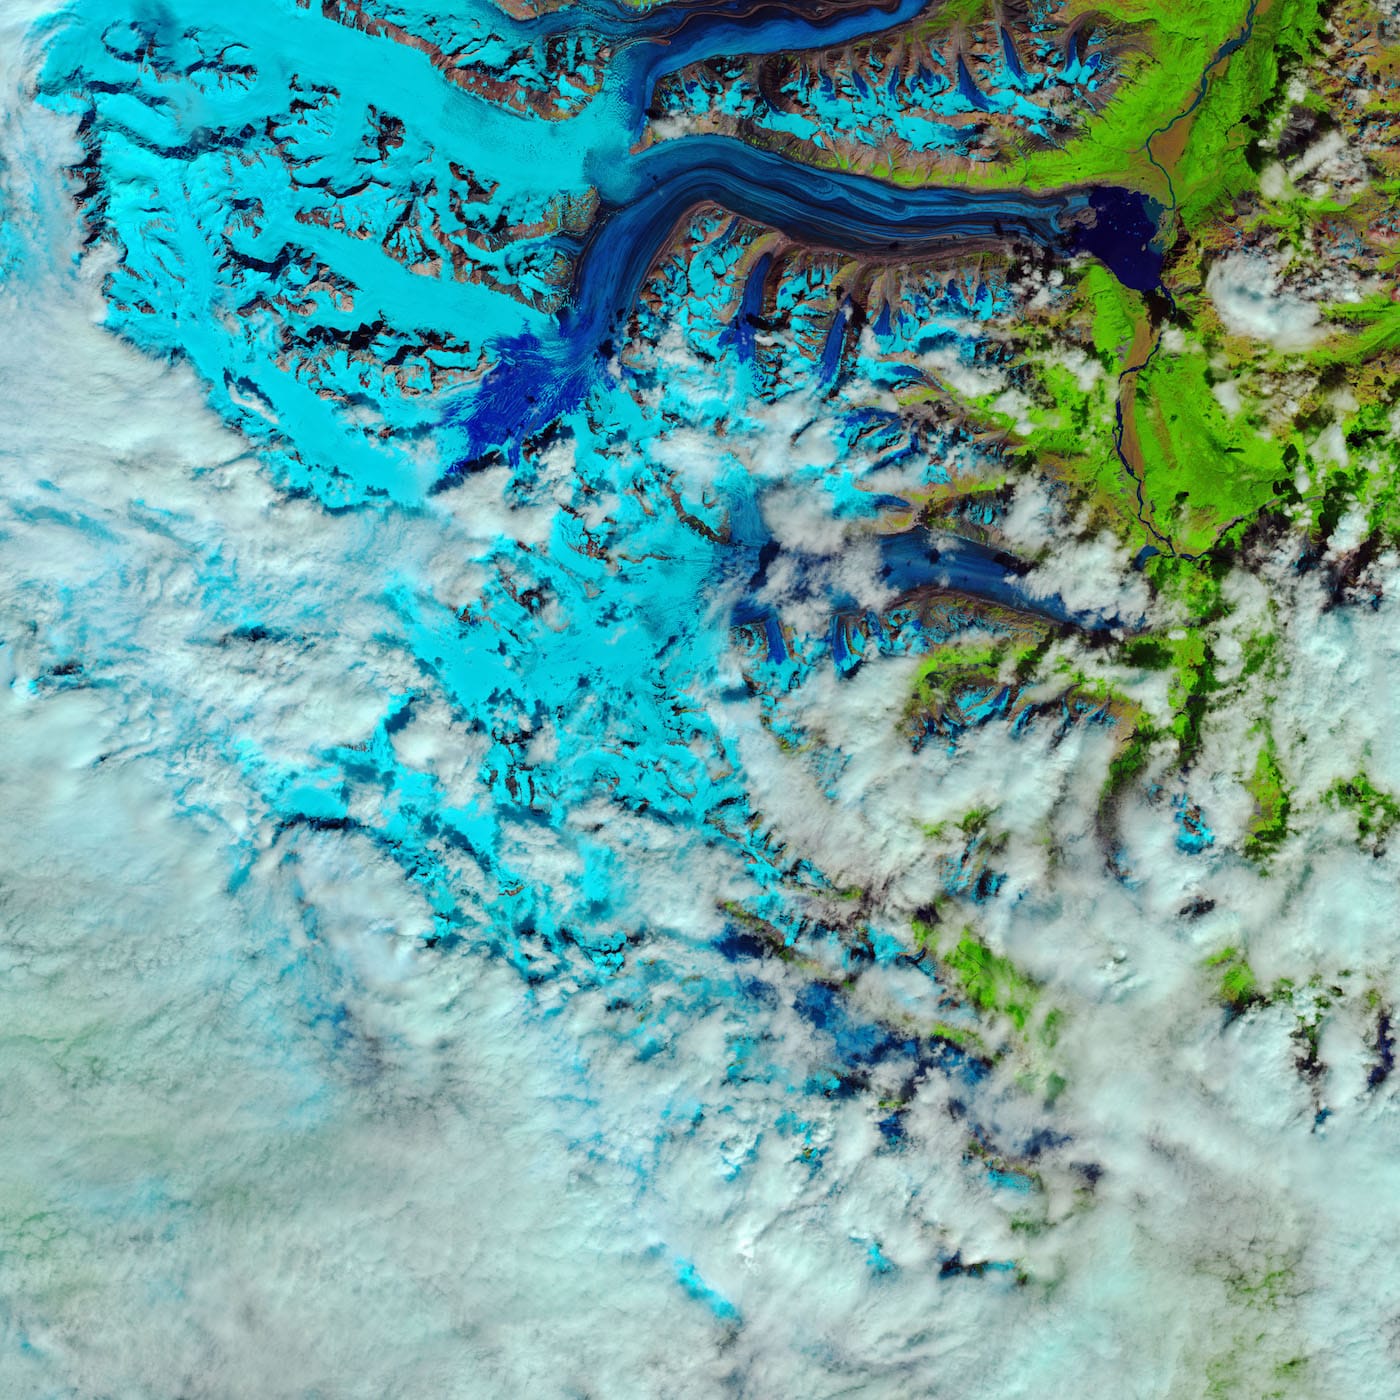
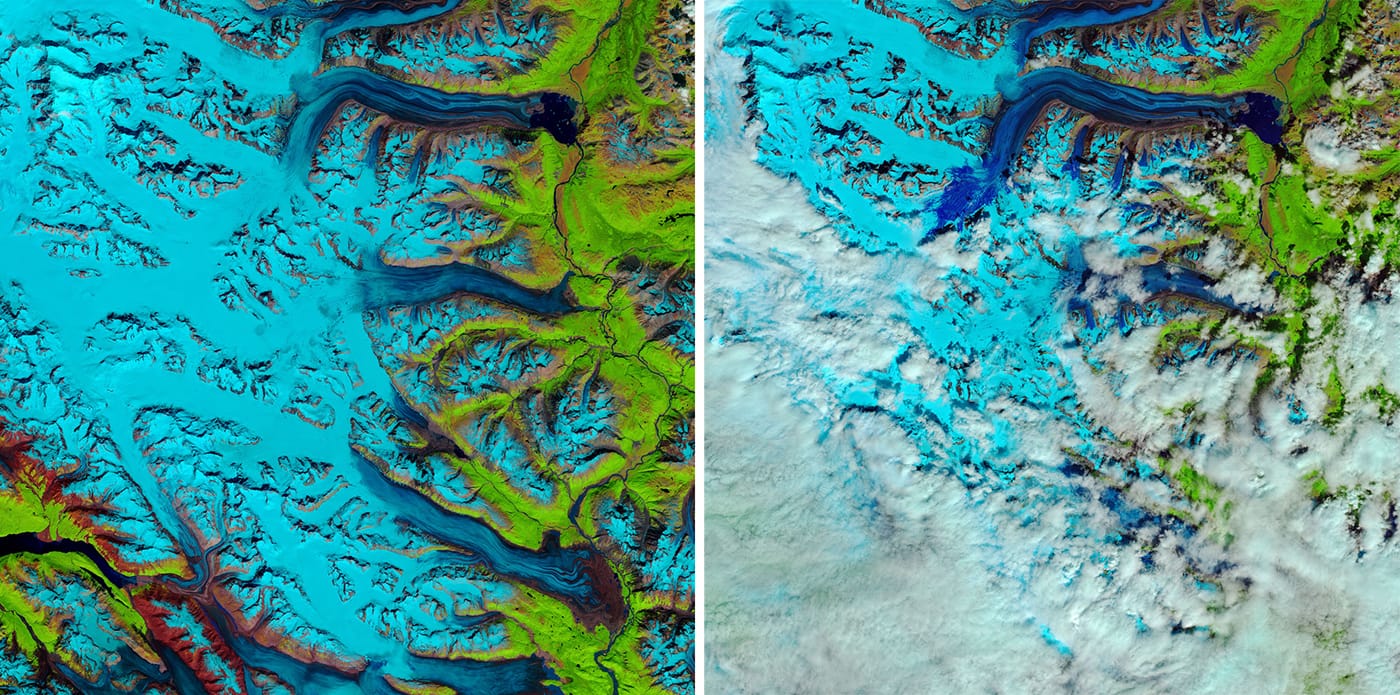
At Earth Observatory, you can use an image comparison slider to watch the Lowell Glacier appear to soften as it transforms from ice to water under the pressure of newly rising temperatures. (The change is far clearer, and more dramatic, with the slider.) The false-color images shown here were taken by Joshua Stevens, the lead for data visualization and cartographic quality at NASA’s Earth Observatory, with the Multispectral Instrument on the European Space Agency’s Sentinel-2 and the Landsat 8 satellite’s Operational Land Imager. They depict the snow’s rapid melt between July 22 and July 26, 2018: frozen water is light blue, meltwater is dark blue; vegetation is green, rocks are brown. False-color images record the electromagnetic spectrum, and colors are differentiated using short wavelength infrared bands.
You’ll notice the dark blue spilling and exploding, like ink or fireworks or stretched tentacles, as if it intends to debunk the frozen water, dethrone it. It’s easy to deny climate change — the way humans have inadvertently sped up the process with our obsessive technologies and veritable disregard for that which gives us a home; it is harder to talk oneself out of images like these, inadvertently beautiful as they are.
When the snowpack melted, the swamp disappeared; by August 11, the slush was flowing into Lowell Lake, located at the end of the glacier. Losing this much water will cause the glacier to retreat (shrink), says Pelto. In Kaufman’s aforementioned article, Luke Copland, who researches glaciers and icecaps at the University of Ottawa, explains that the Canadian arctic is “warming by 1 degree Celsius in the last 20 years” alone, “a doubling in how much ice gets lost each year.” It’s a pattern likely to continue.