Transforming Charts and Graphs About Climate Change Into Art
Data visualization artist Alisa Singer's exhibition Environmental Graphiti turns raw climate information into semi-abstract portraits.

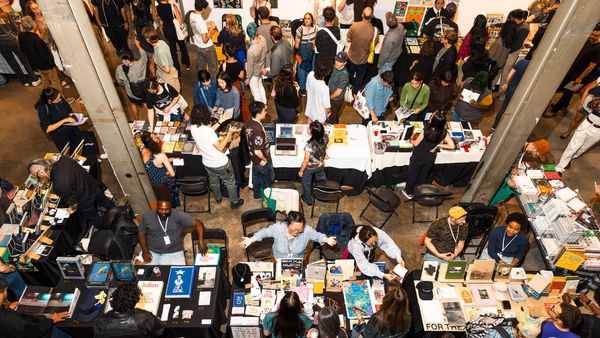
In this era of Big Data, it seems that every action we take can be measured and analyzed for financial or political gain. What websites we visit, how we buy our goods, the music we download, even our vital signs and physical activity can be collected and stored. In 2018, Forbes reported that “Over the last two years alone 90 percent of the data in the world was generated.” Because of this, data visualization has become more prevalent at various news sources, an attempt to make sense of this proliferation of information. Hand in hand with this, we are seeing the rise of artists who use data itself as a medium. Chicago-based artist Alisa Singer utilizes statistics around global warming in her exhibition Environmental Graphiti: The Art of Climate Change, now on view at the Peggy Notebaert Nature Museum.
Singer’s work brings to life various charts and graphs made about climate change in vivid color. While the pieces may initially appear abstract, a closer look will show that each one is patterned after real scientific data (each is accompanied by a wall tag with the corresponding chart). Speaking to the artist on the phone, she explains to me that while people are becoming more aware of the threat of climate change, many still don’t understand the scope of the problem. She wants to “enhance public awareness of science,” and says that “art is uniquely suited to this mission.” The juxtaposition of the artwork and the raw data creates a dialogue which helps the viewer better understand the data and underlying science. Singer wants people “to come away with some nuggets of info and a sense of urgency and broad comprehensive impact of the problem.” One of her pieces was used as the front cover for the United Nations’ report “Global Warming of 1.5°C,” released in October 2018.
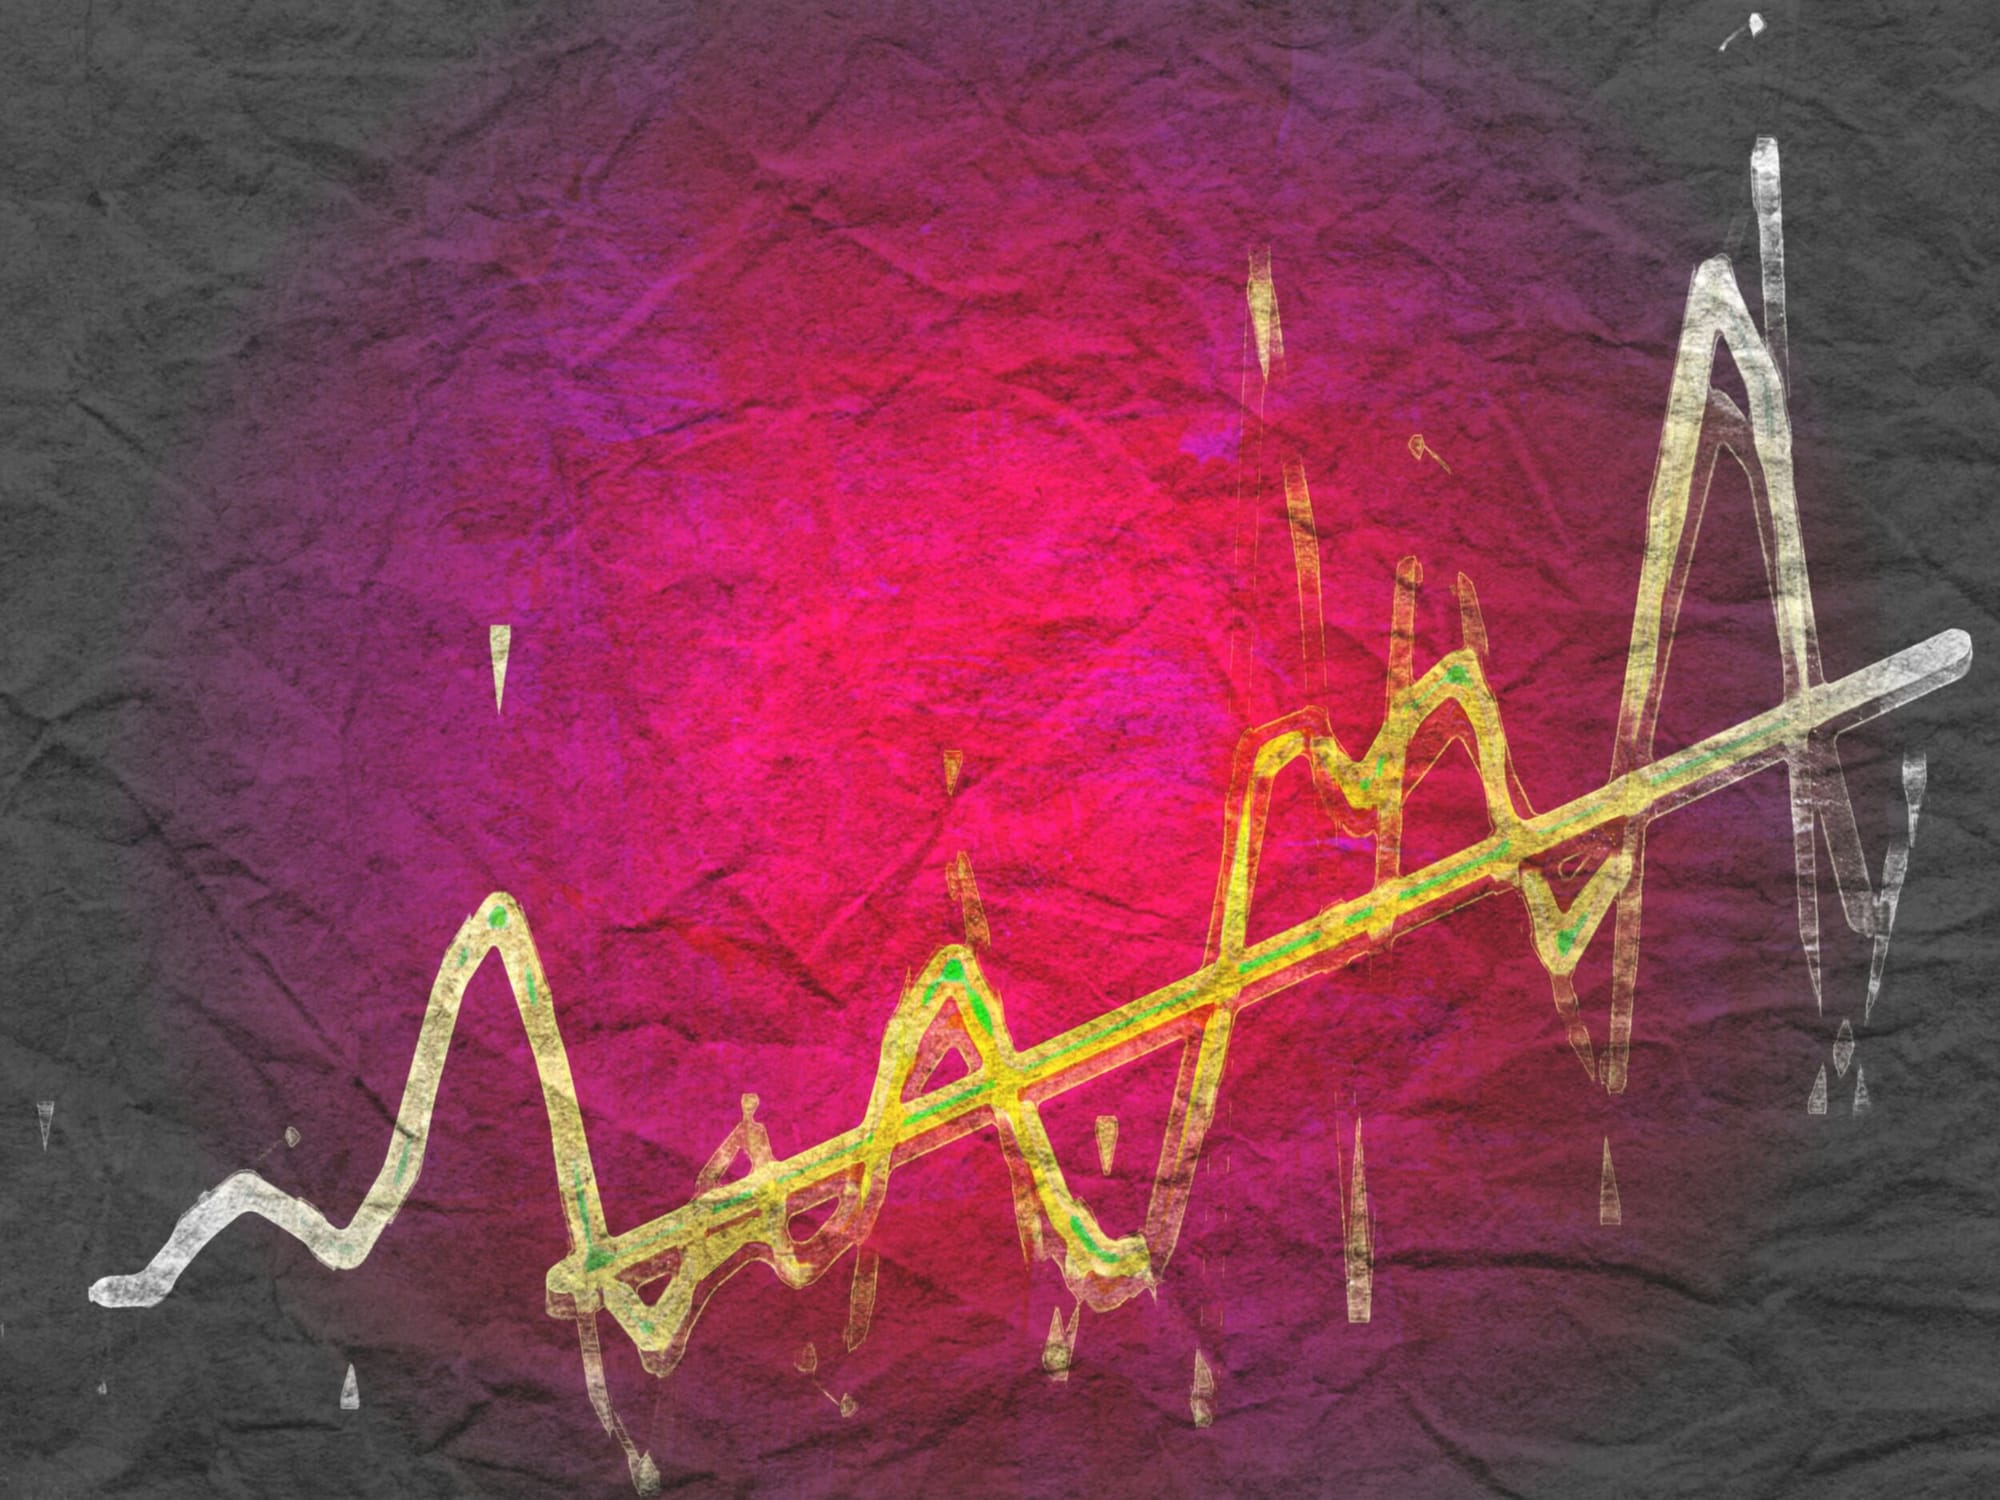
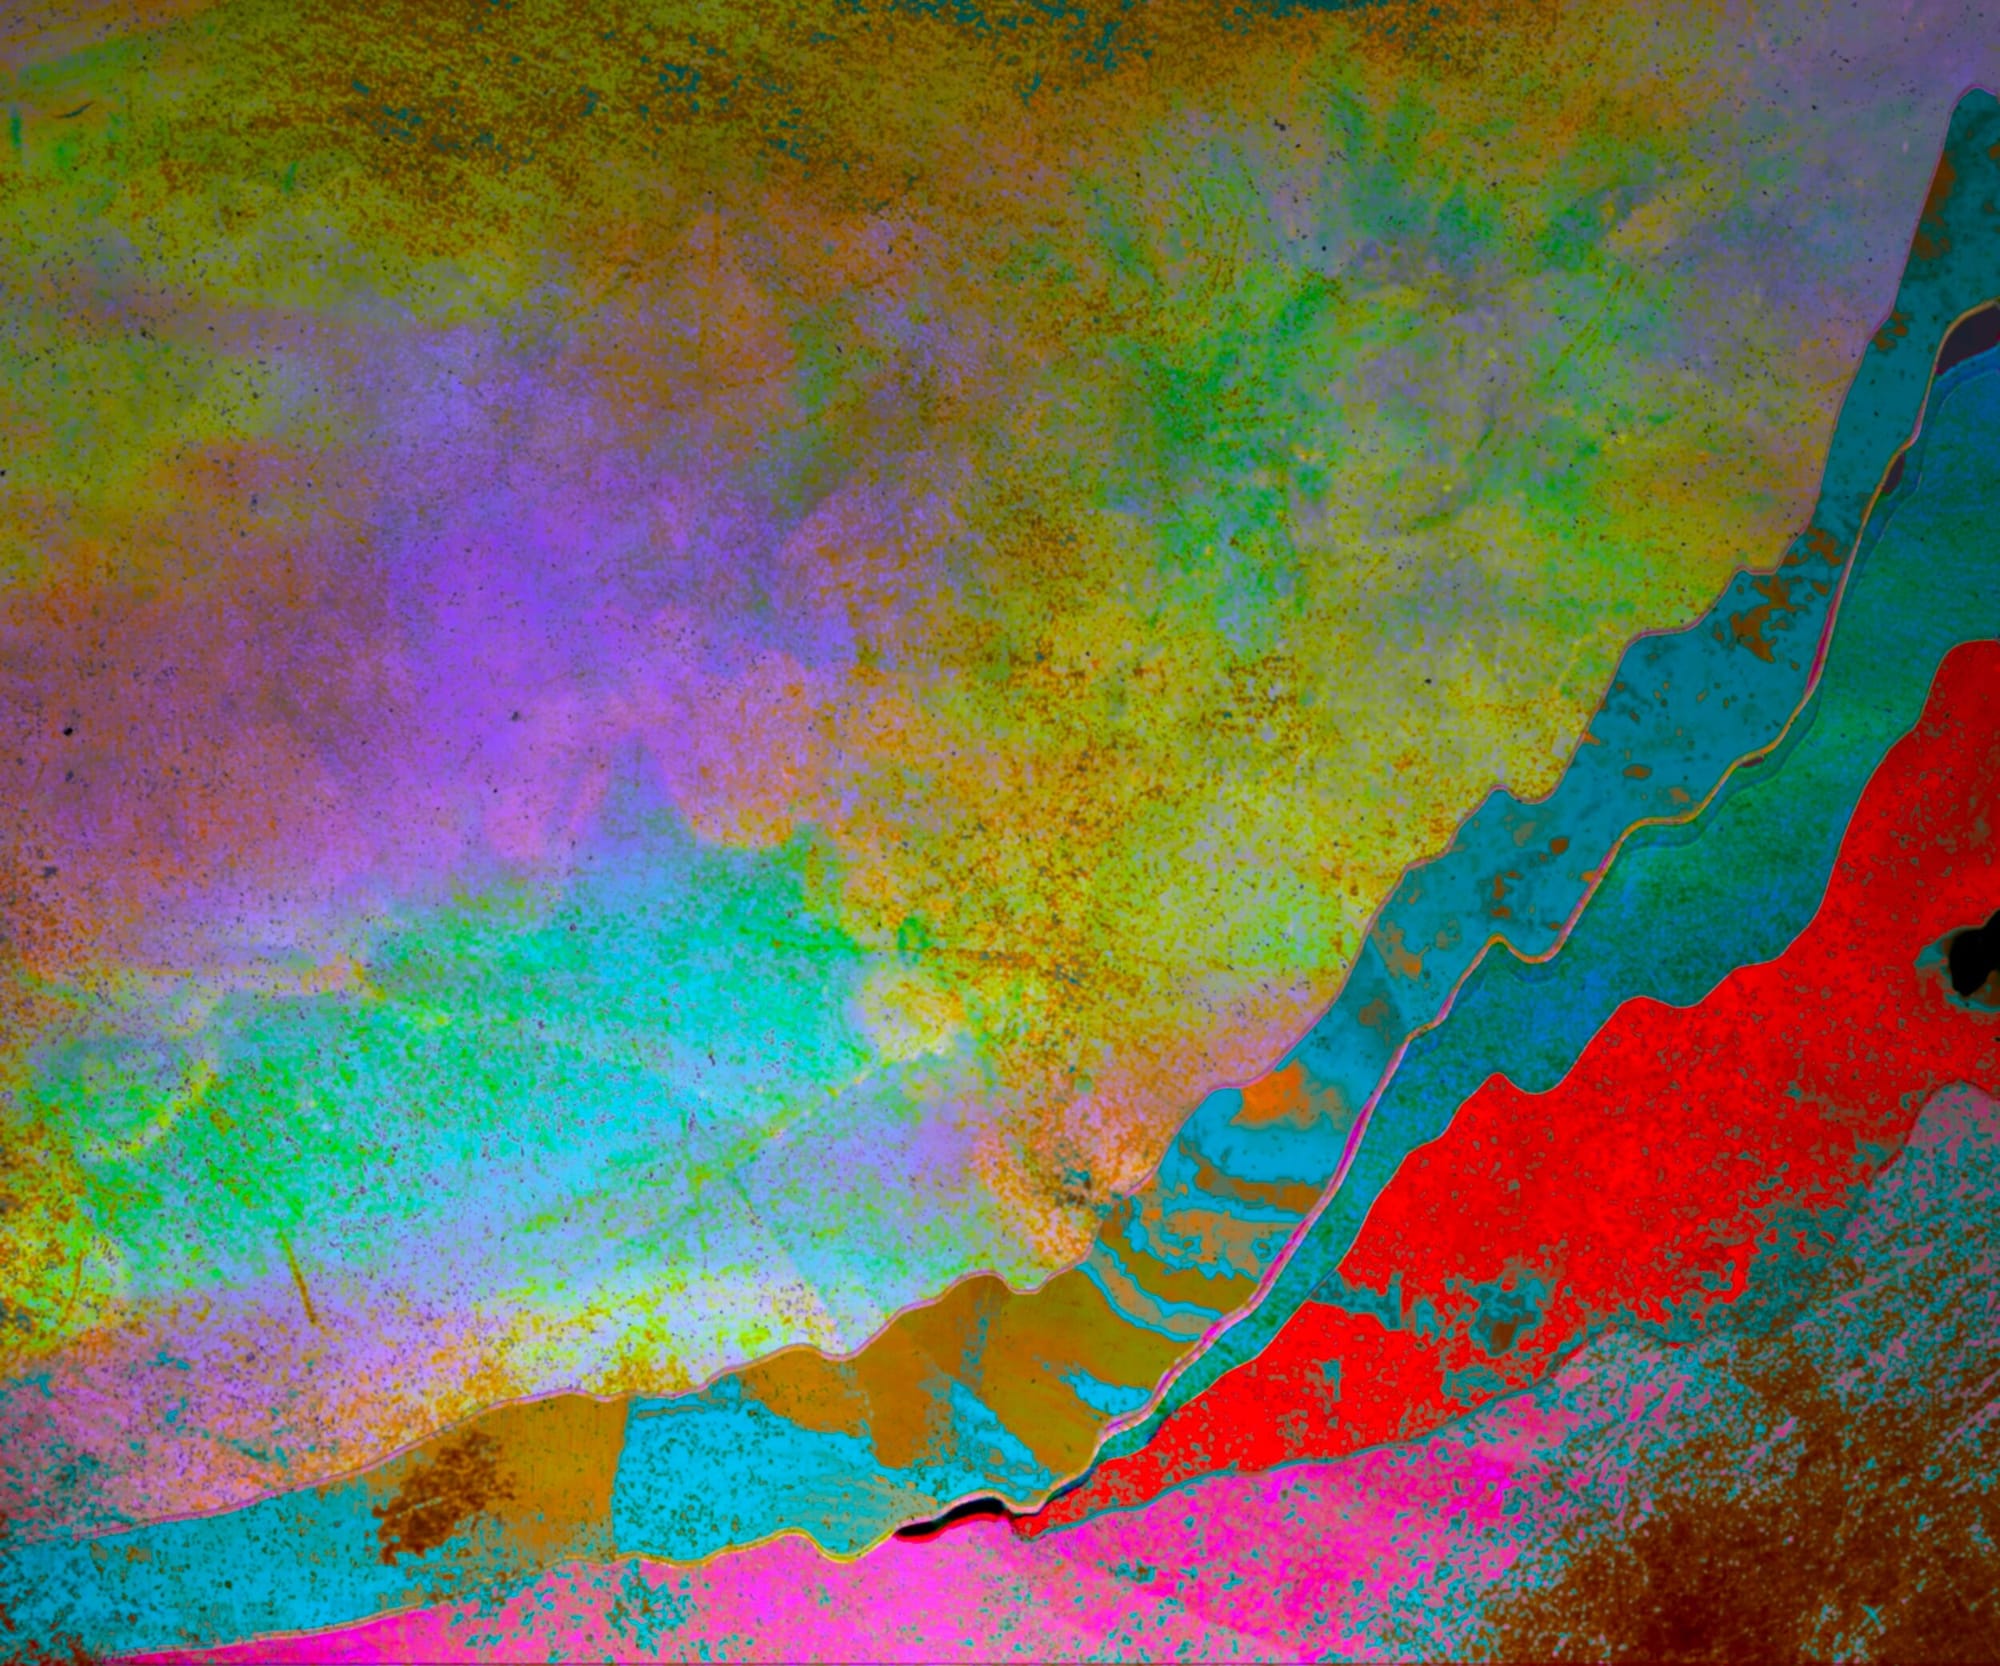
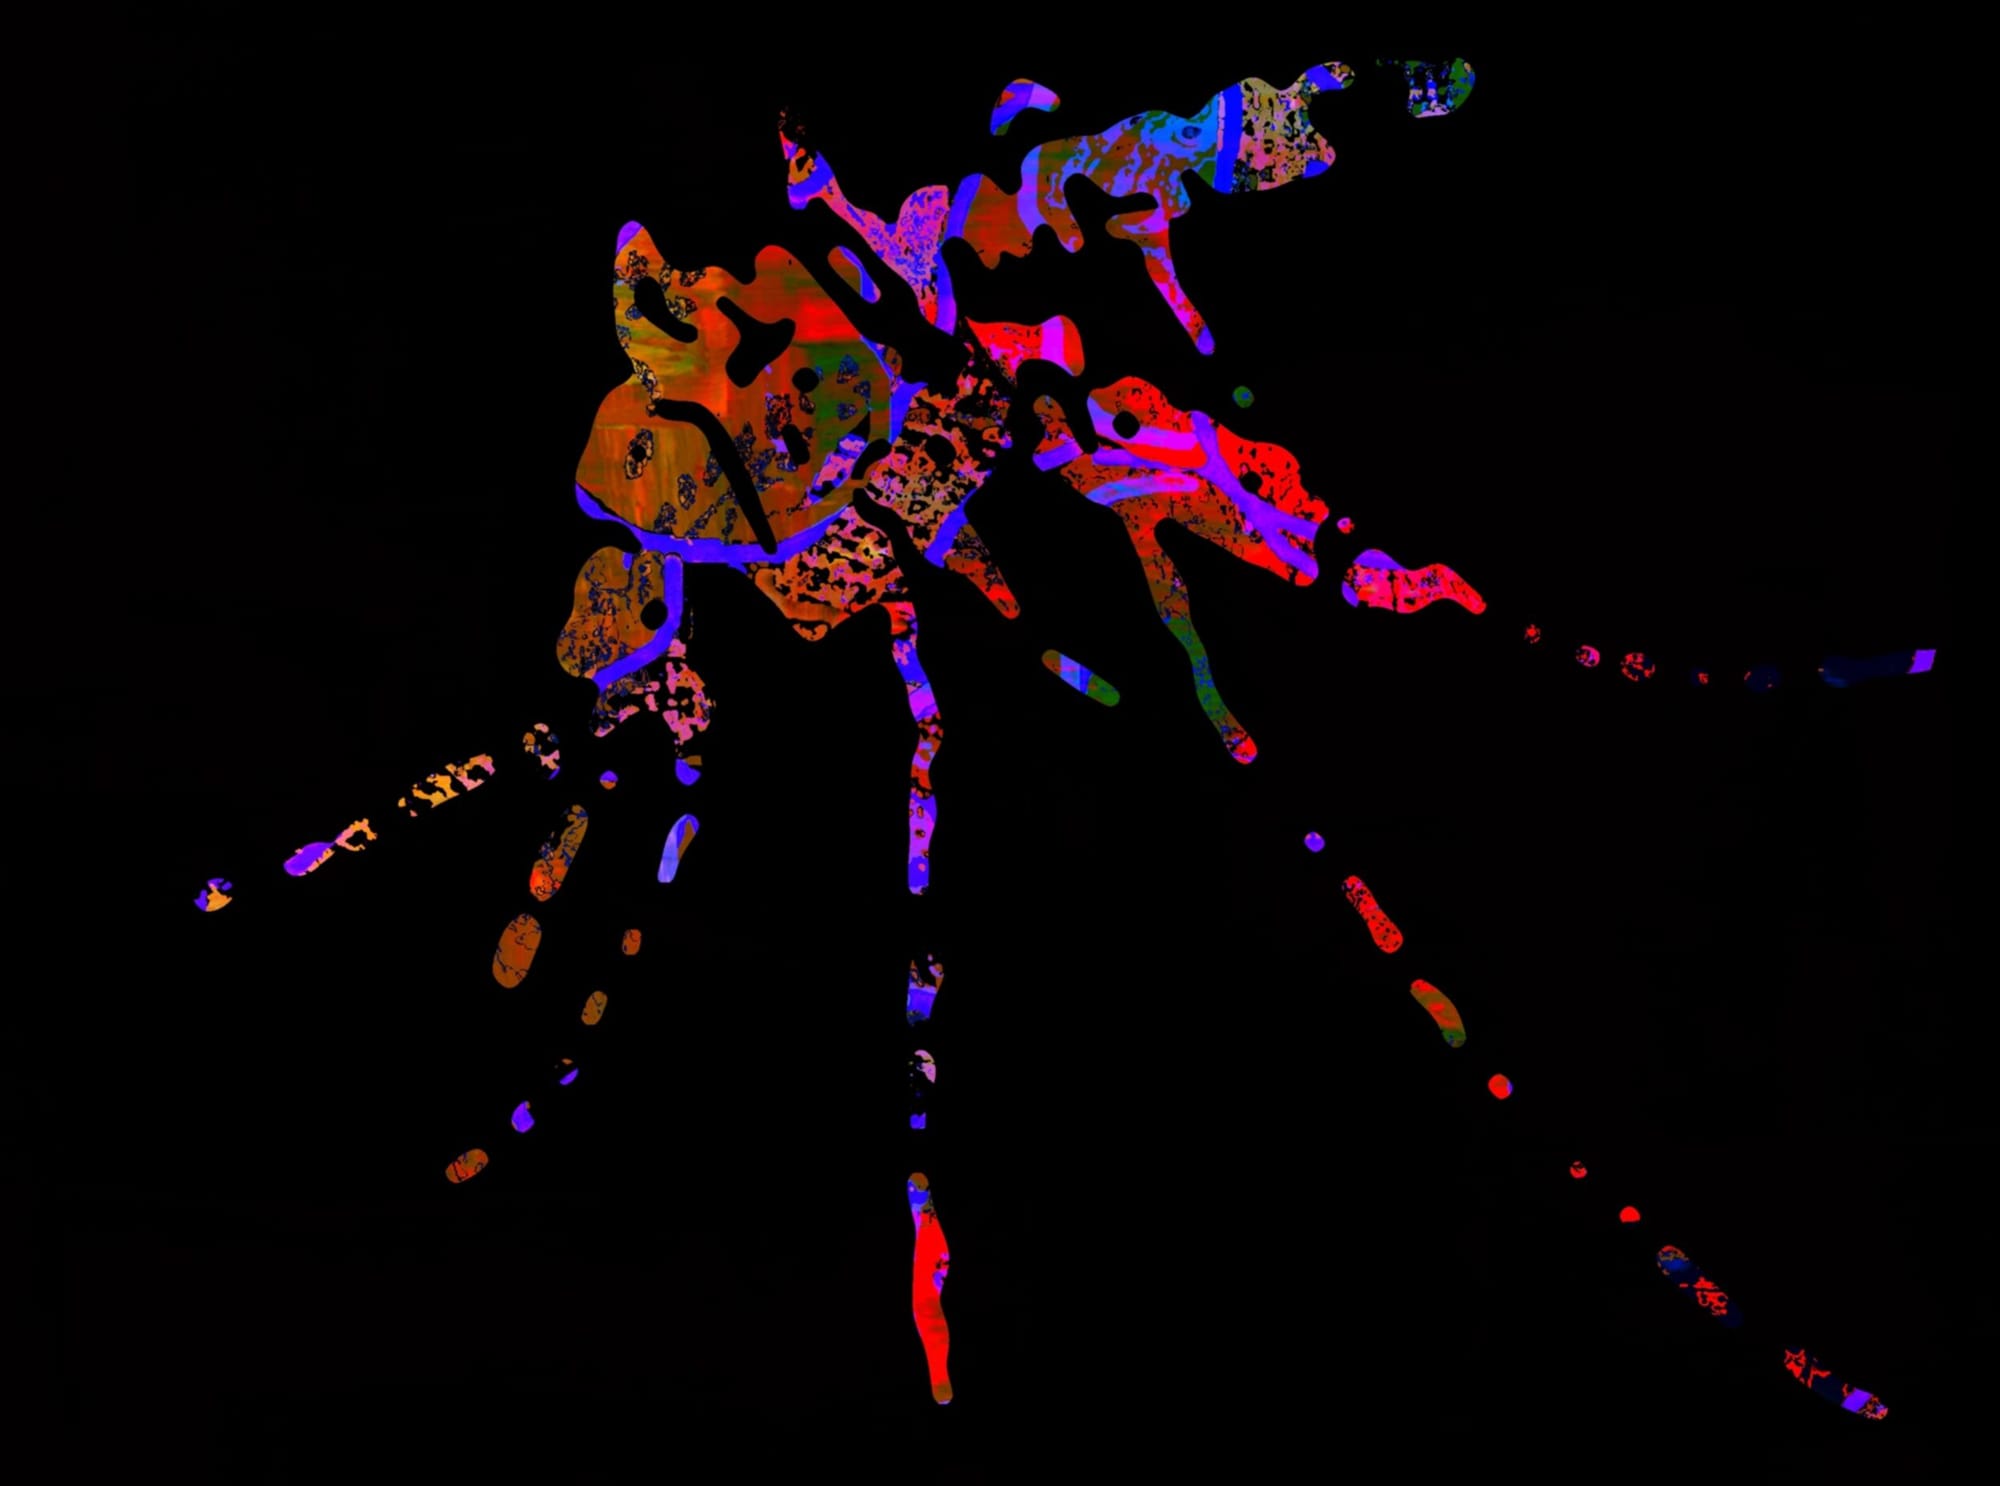
The exhibit is organized thematically around four specific categories: “Why is our climate changing?”, “How is climate change affecting our world?”, “Who is at risk?”, and “What can we do to address climate change?” In the “Why” section, for example, a bright rainbow-hued piece called “Global Carbon Emissions by Source” uses data from an area chart from the Global Carbon Project. In the “Who” section, one work depicts a yellow line with rising peaks and valleys on a background of magenta. It’s based on a line chart showing “Trends in Strengths of Hurricanes” from the US Global Change Research Program. Not all the art is based on graphs and charts. “Vector-Borne Diseases” forms the shape of a mosquito out of names for diseases, such as dengue and malaria, which are transformed into colors and shapes.
Singer explains that her process begins with figuring out a key data point she wants to work with, and then “finding an interesting graph I can use from a credible source.” Next she takes the chart or graph in question and deconstructs it to its core elements, and then reconstructs it. She says that her work is not meant to be illustrative of the charts, but reinterpretations of them.
Singer began working in this mode after retiring from a career as a corporate attorney. She always wanted to be an artist, but decided not to pursue it until now. She wanted to “combine art with something worthwhile.” Her first project was working with The Chicago Lighthouse to create Braille greeting cards. When she finished that, she decided to focus on this project. Singer emphasizes that she wants people to understand that climate change “isn’t a problem for the future. It is clearly happening now. And it can only be solved with people here now.”
Environmental Graphiti: The Art of Climate Change is on view at the Peggy Notebaert Nature Museum (2430 N Cannon Drive, Chicago) through March 2020.