Did the Ancient Romans Use Infographics?
A new book by classicist and historian Andrew M. Riggsby investigates the types of information technologies drawn, painted, and inscribed on the surfaces of the ancient Roman world.

How did regular people within the ancient Mediterranean use visual aids such as lists, calendars, maps, tables, weights and measures, textual illustrations, and even building plans in to organize, access, and then understand the world around them? A new book by classicist and historian Andrew M. Riggsby investigates the types of information technologies (IT) drawn, painted, and inscribed on the surfaces of the ancient Roman world and explores how they shaped the daily life of Romans. As Riggsby demonstrates, effective graphic design has been a tricky but important ability for thousands of years.
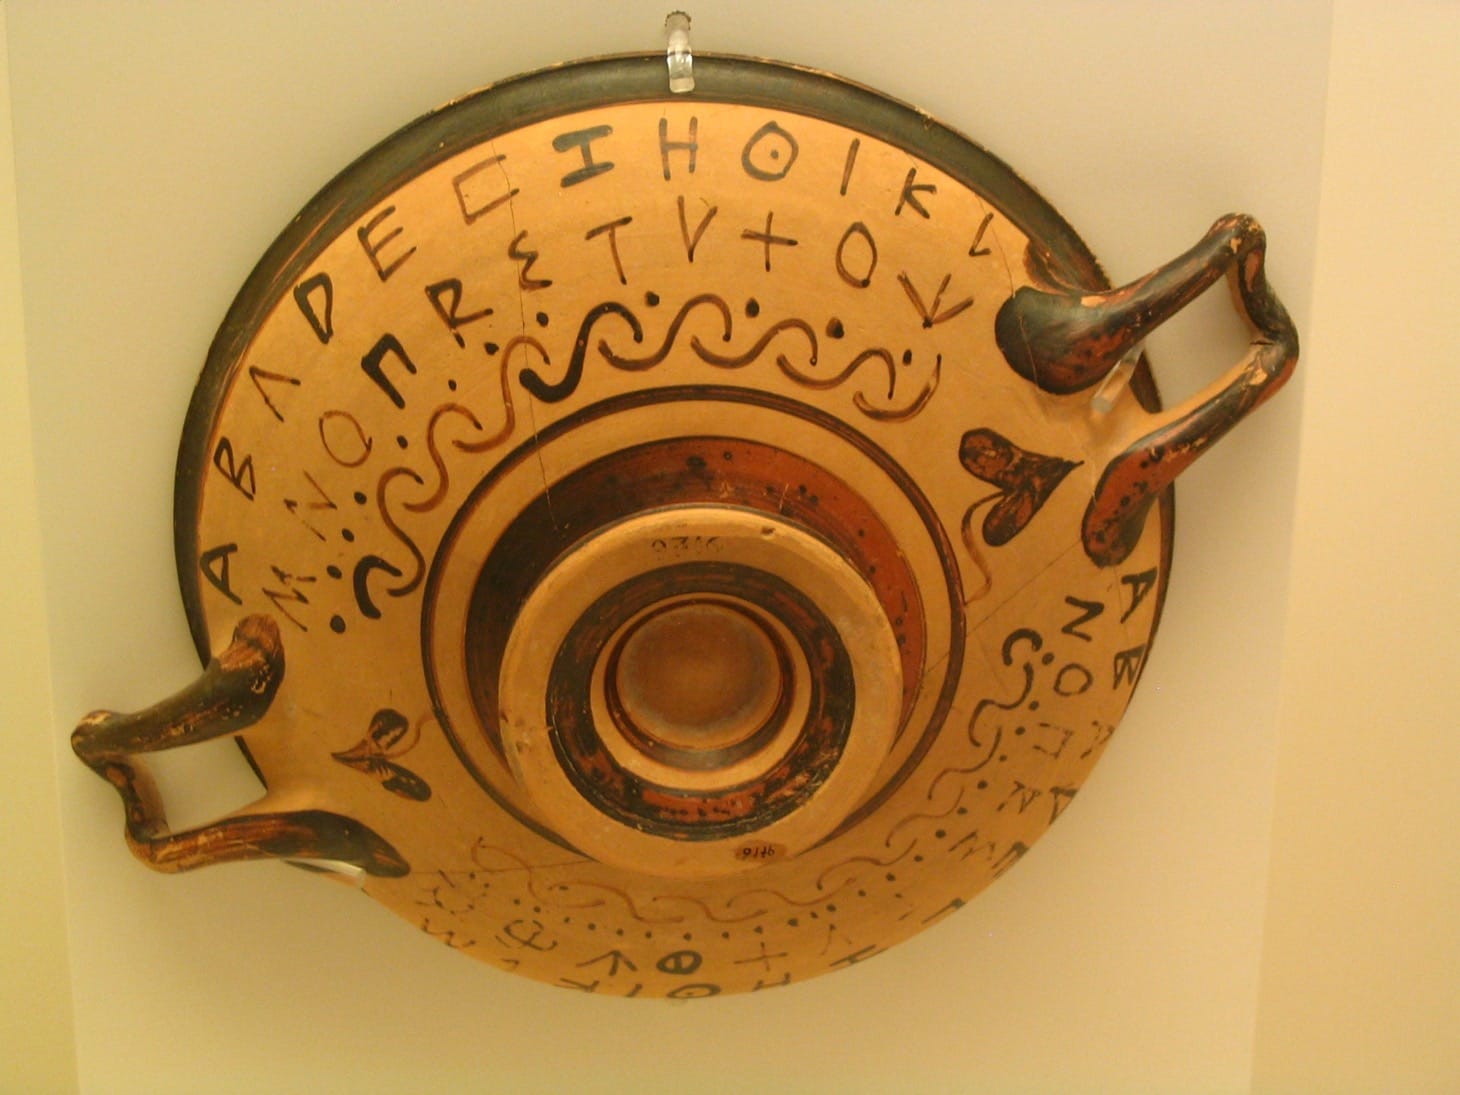
In Mosaics of Knowledge: Representing Information in the Roman World, Riggsby looks at the historical use of visual information technologies and the Roman use of what many today might term “infographics” in the period from the founding of Rome in 753 BCE until 300 CE — just a few years before the ascent of the emperor Constantine and the empire-wide growth of Christianity. As he notes, the most basic of informational technologies is the list. From the Sumerian King List to the catalogue of ships in Homer’s Iliad, lists were a rudimentary but important information graphic. Going beyond simple lists, Riggsby examines the rarified use of tables of contents, alphabetized lists, and indices. Alphabetical lists in Latin go back at least to the playwright Plautus, around 200 BCE, and we know that students all over the ancient Mediterranean regularly used a device called an abecedarium, which helped teach them the letters of the alphabet. Our earliest Greek & Etruscan abecedaria date to around the eight century BCE.
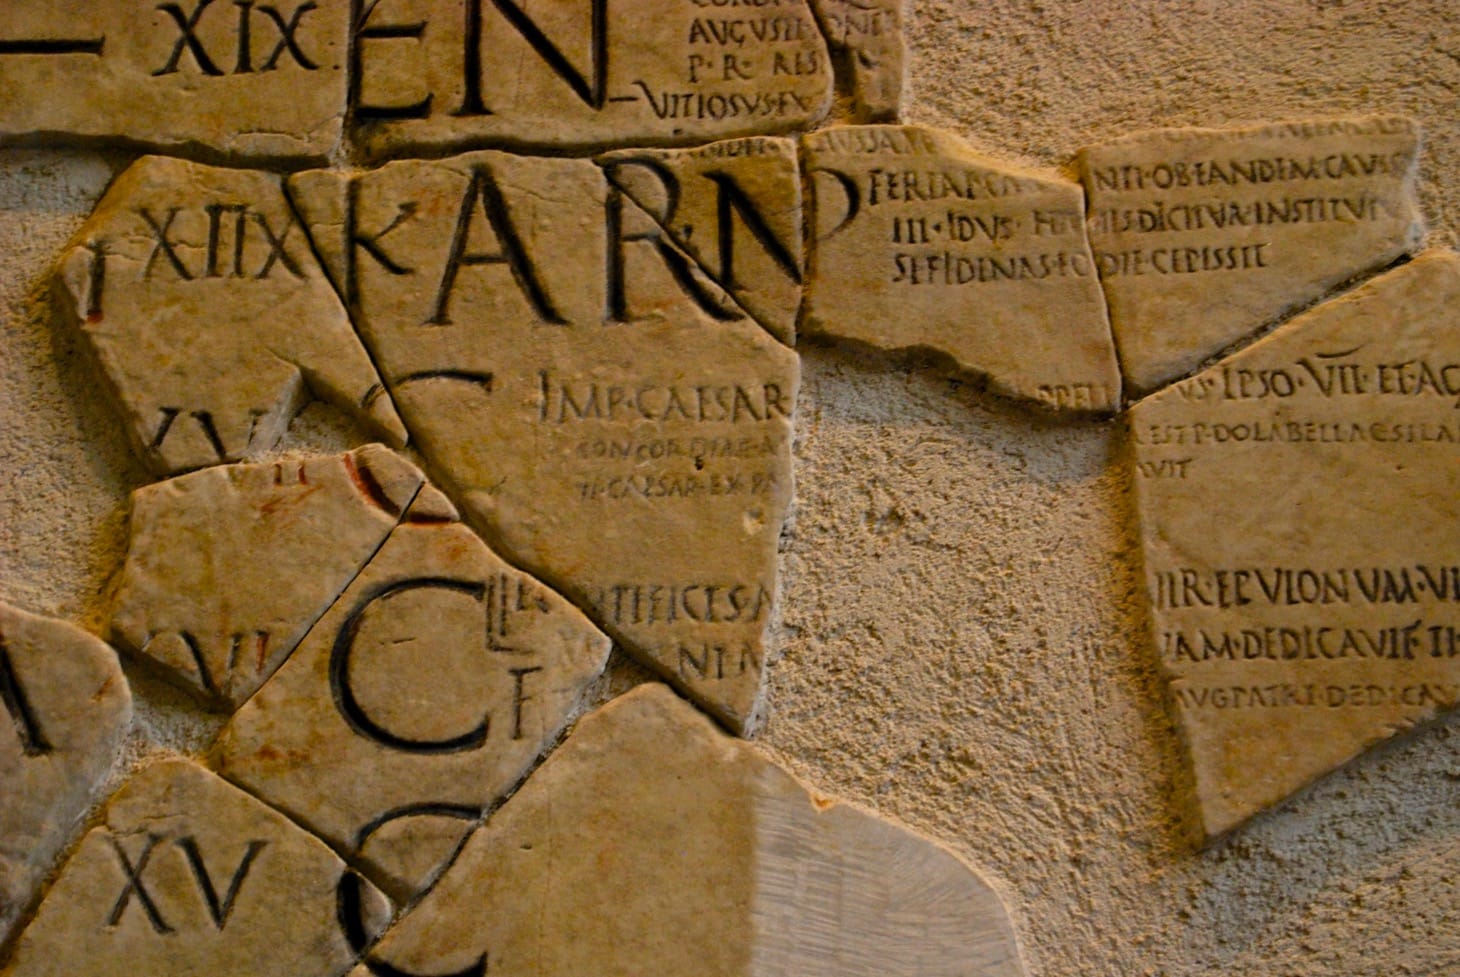
Romans particularly used numbered lists for archives, buildings, administrative regions, military units, distances, and time. Prior to the rise of the codex format, which we would later simply call a “book”, organizing was not done by pagination within scrolls, but rather by rows and chapters within a particular scroll. Riggsby reiterates the rarity of Roman tables of contents within literary works, but there was an abundance of indices. In public, Romans also encountered public inscriptions with lists of consuls and also calendars, called fasti. These calendars used abbreviations and color coding: marking each set of nine days under the month alphabetically, A through H, in order to signal the nine-day market cycle, highlighting special festival days, and often noting the civic or religious import of the day with the letters F, N, or C. These fasti are also a stark reminder that when there are no formal weekends (and there weren’t in antiquity), one needed to travel to the forum and read the calendar to know about all the festival days off from work or state business.
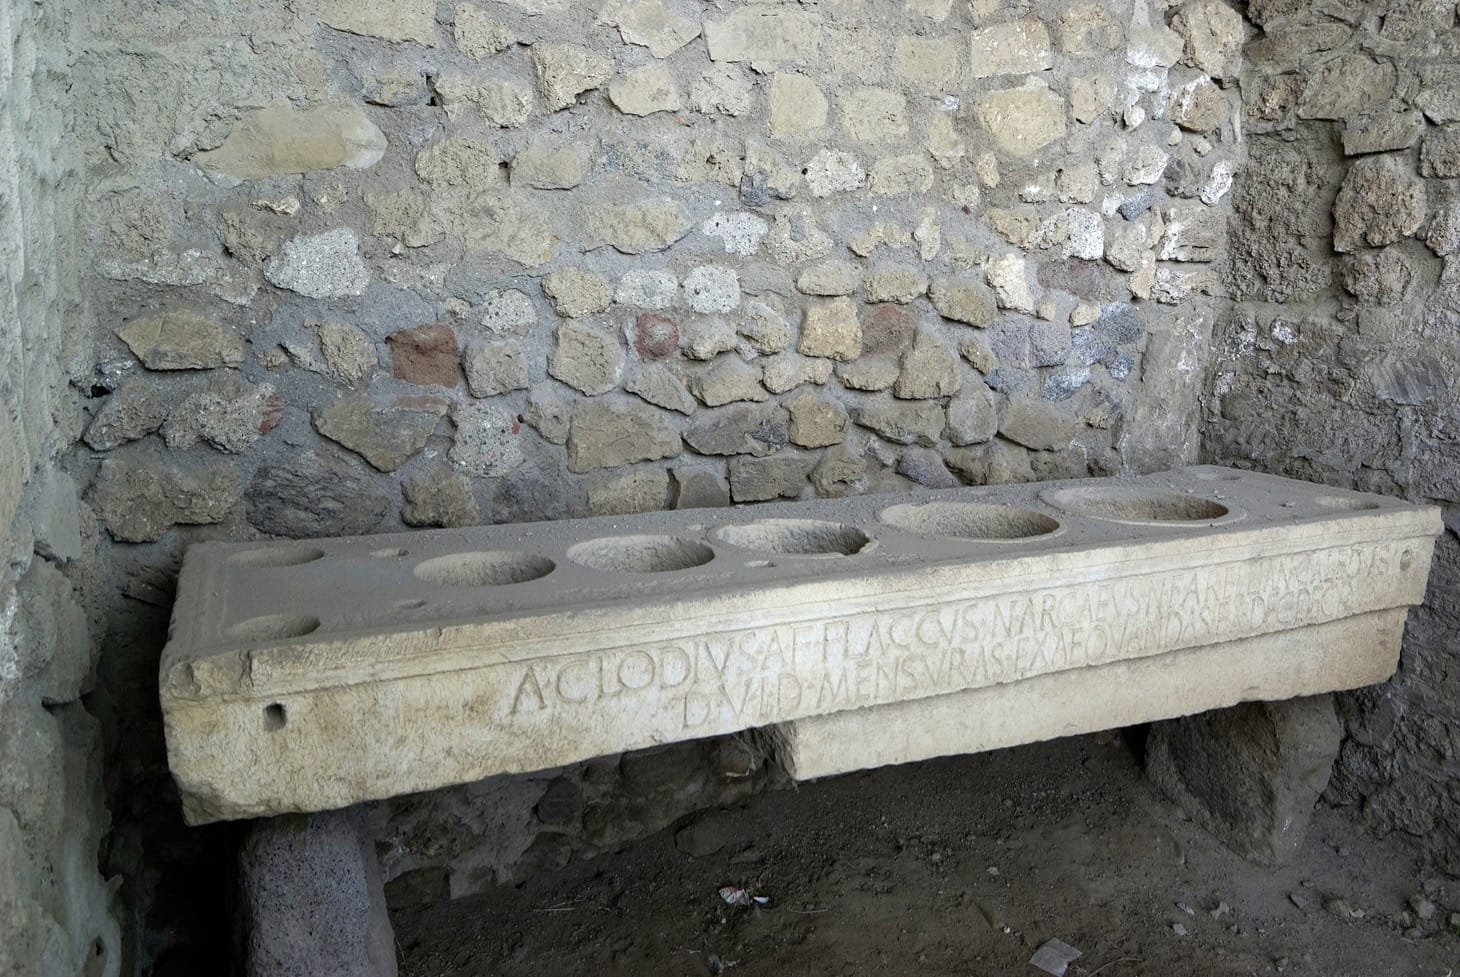
While some Roman kings and bureaucrats may have idealized a universal system of weights and measures, Riggsby argues that a Mediterranean-wide standardization was never achieved in Roman antiquity. However, Romans did have an extensive system for abstracting and then aesthetically or physically representing weights, measures, and amounts of money which would come to influence later Western systems. There are a number of Greek and Roman examples of measuring tables from the ancient world which attempted to allow measurement of volumes as well.
Clocks were an important type of informational device that allowed Romans to measure time, but they can also double as art pieces and statements of wealth. While the technology governing timekeeping may have changed, for Romans in antiquity it was important to visually represent time — even if the length of Roman hours were not completely standardized, as ours are, and could vary by time of year. Riggsby notes:
Ancient time-telling, as modern scholars have noted, distinguishes two different activities (and their associated devices) far more sharply than we do today. Water clocks were the primary means of measuring duration of time … Sundials, by contrast were used to synchronize activity.
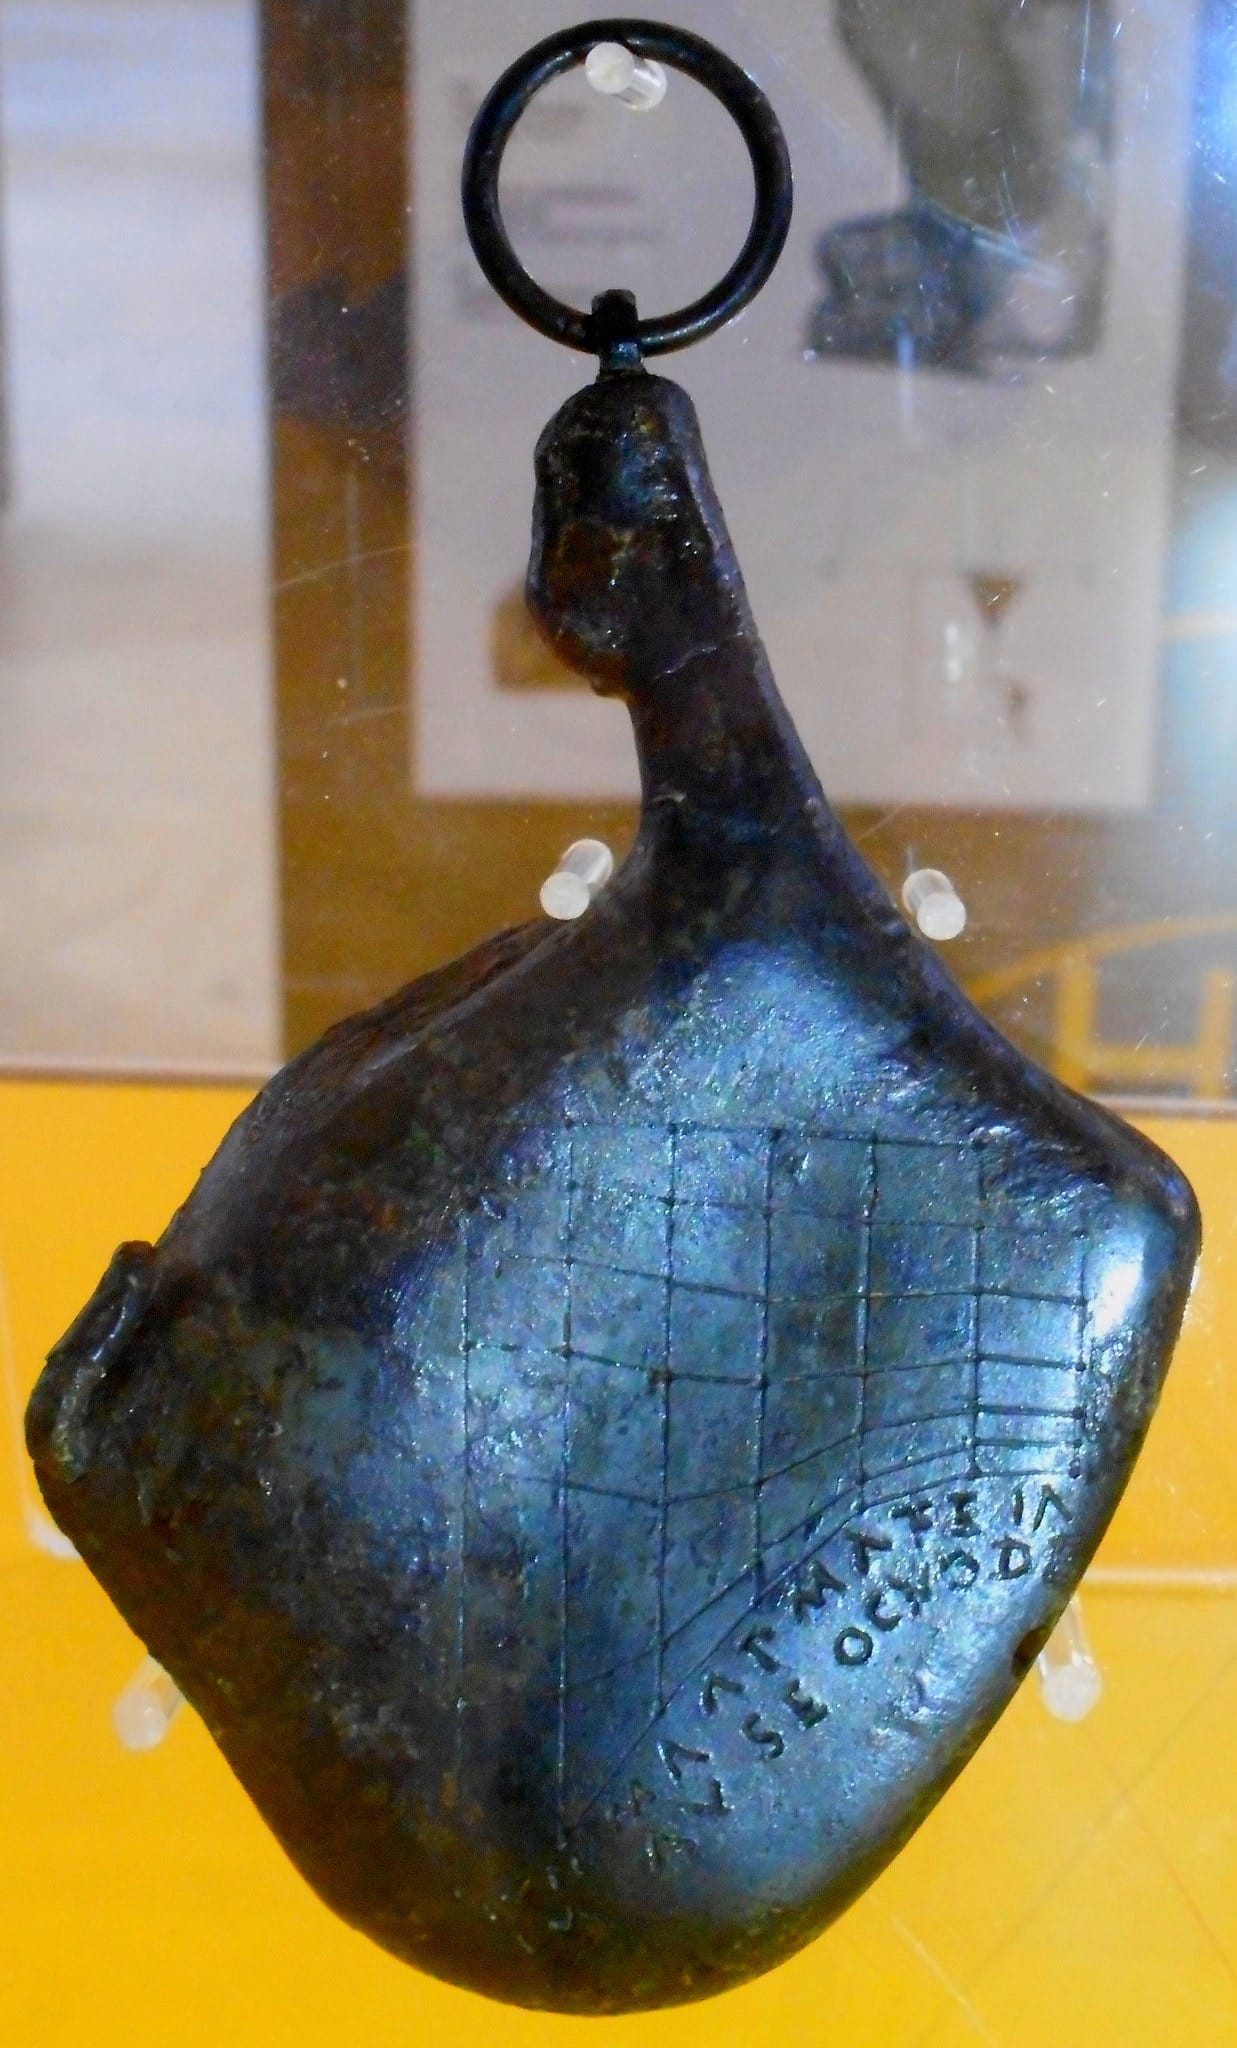
There are even more numerous examples of portable models of sundials one could carry that could err widely based on the latitude, season, and time of day. But, just like the Rolex or Apple Watch of today, portable watches might have been seen as more of a fashion trend for the elite rather than a technology that was always accurate. Perhaps the most inventive portable sundial is one found at the Villa dei Papiri at Herculaneum, which is shaped like a ham.
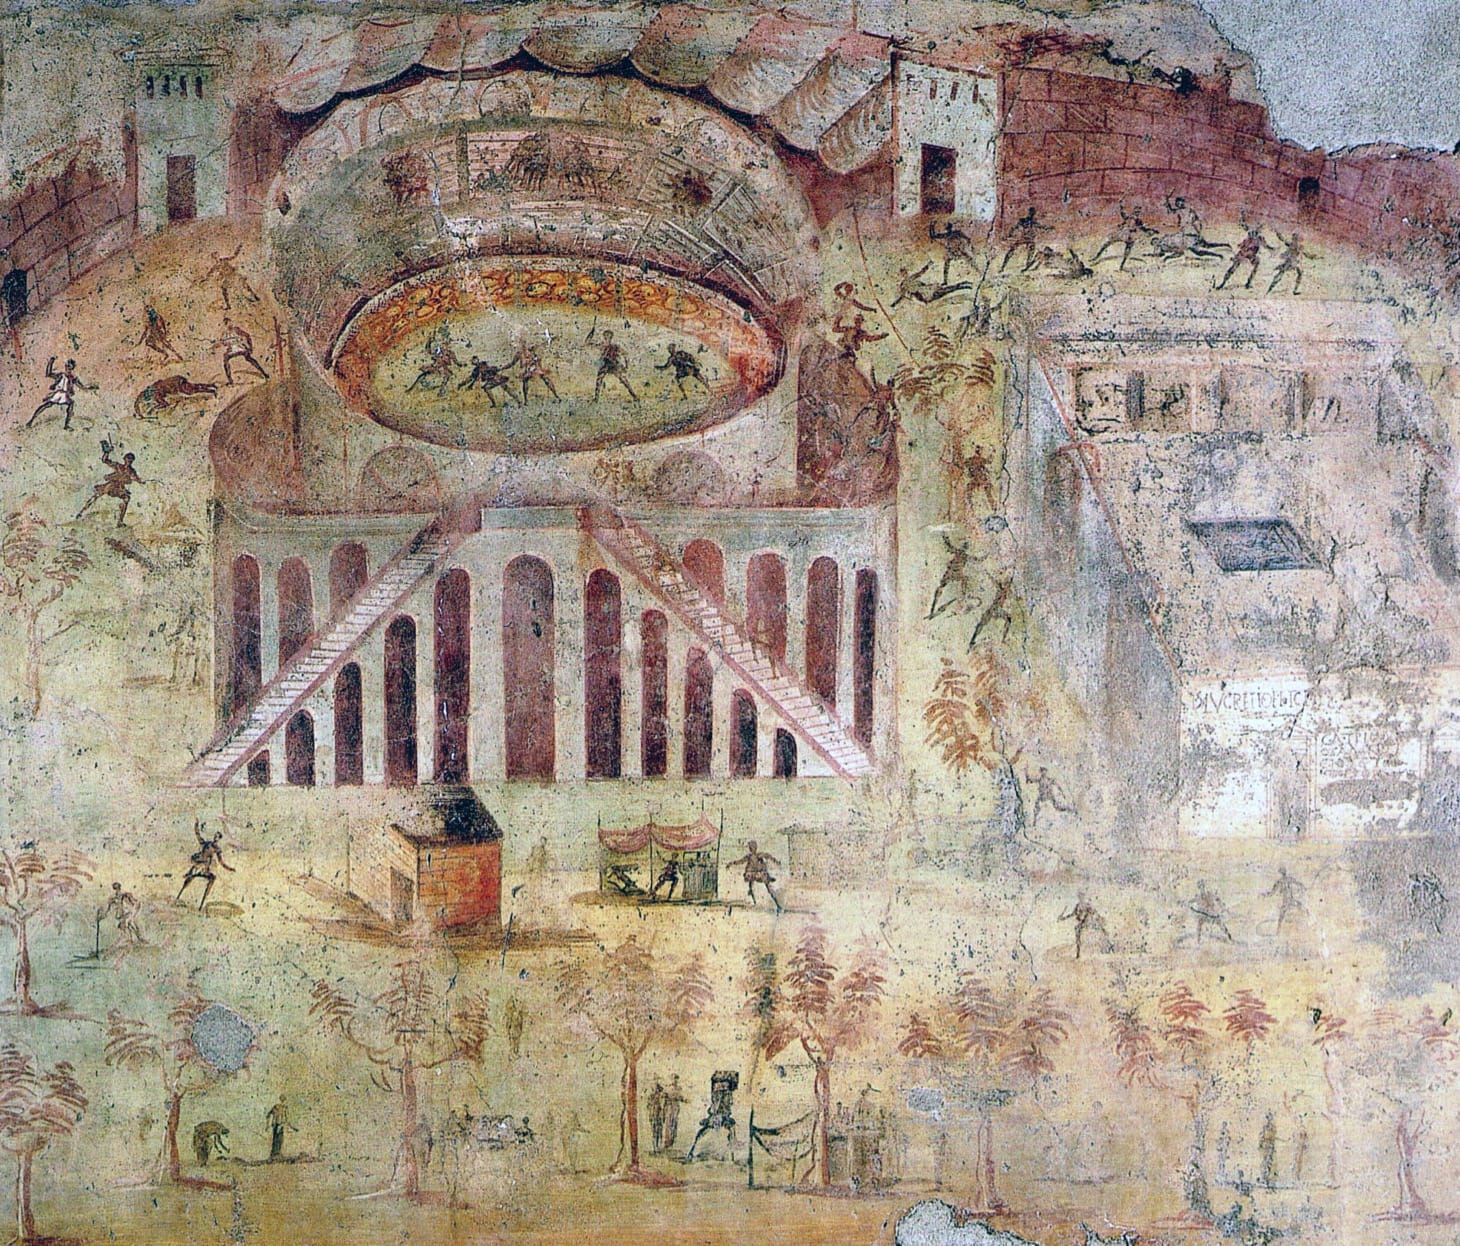
In the section on three-dimensional painting, Riggsby predominantly looks at how Roman painters represented space in landscape images through fresco and in stucco relief. He argues that Romans were not primitive painters and, in fact, did adopt tactics for representing objects in three dimensions in their painting, ultimately creating “a network of connections at a distance which gives three-dimensional structure to representations even if they cannot be precisely or uniquely reconstructed.” Color was often used to in order to differentiate and represent spatial relationships in Roman painting. A famed wall painting of a riot in the amphitheater at Pompeii shows surprising depth and a three-quarter view from above. There is a clear spatial system at play in the painting, even if the plane is not depicted in a “real,” that is perspectival, manner.
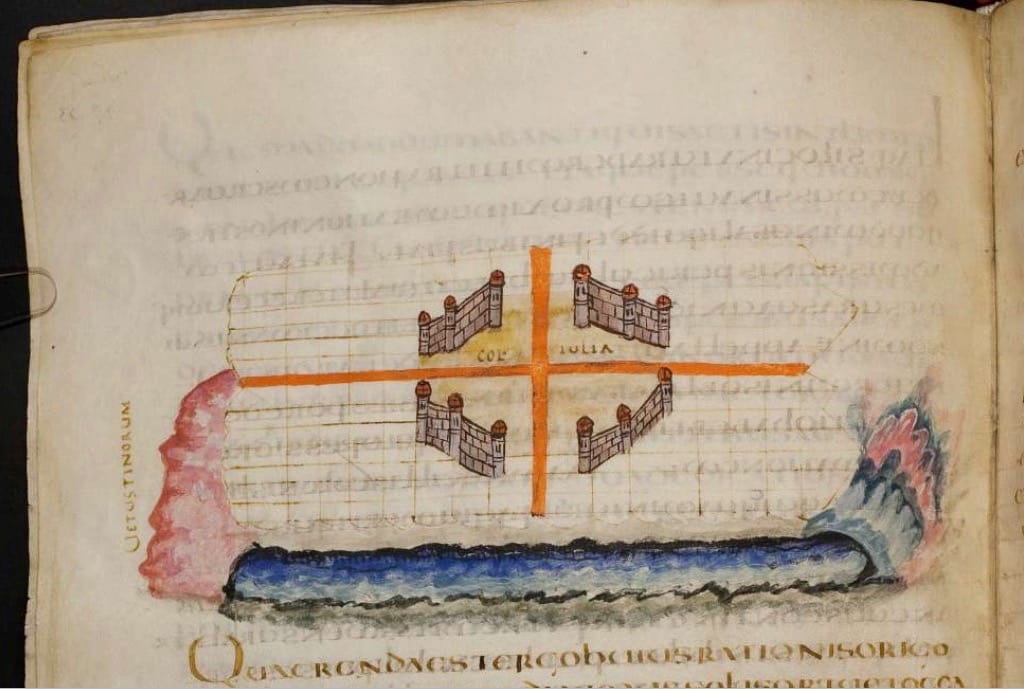
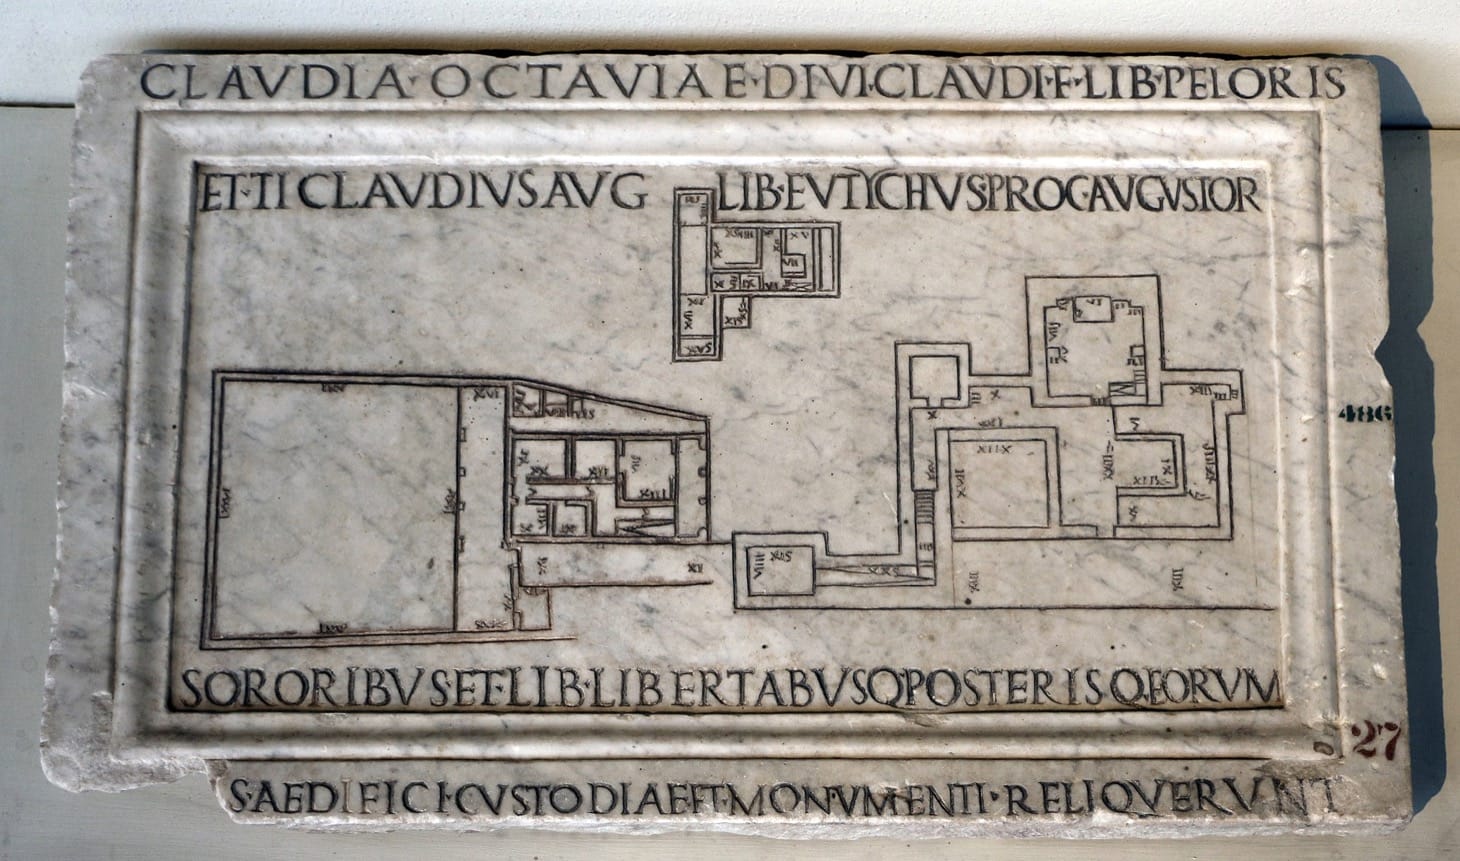
Mosaics of Knowledge underscores the fact that there were no modern data graphics such as the scatterplot, pie chart, bar graph, timeline, or musical staff notation in the Roman world. However, Romans did have occasion to use diagrams and maps, particularly when representing property lines as recorded by professional land surveyors. Romans did not make extensive use of textual illustrations in literary and historical works, but the handbooks for the Roman land surveyors collected and passed down through the Imperial Period were an exception to this rule. Additionally, the survival of building plans from antiquity gives yet another window into how Romans abstracted and then represented space for viewers. Building plans etched on tombs could serve as a memorial while also asserting ownership. One such plan from a tomb in Rome built by former imperial enslaved persons survives today, and would have visually told the viewer that the mausoleum they saw before them did indeed belong to the inscribed couple noted on the epitaph.
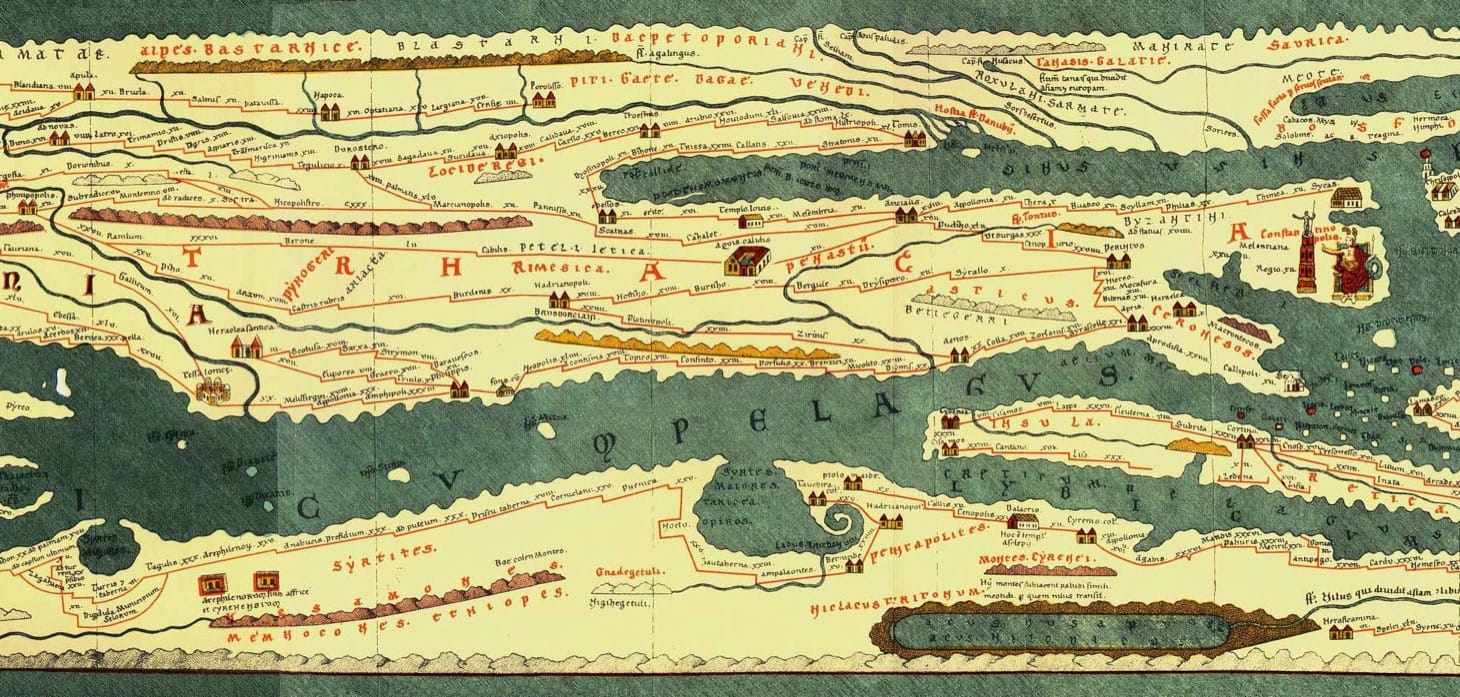
In his section on Roman mapping, Riggsby makes a strong argument for the creation and use of maps in the ancient world. Even if many modern geographers have discounted these ancient depictions of the Mediterranean world and its cities as lacking the consistent scale needed to fit their idea of a true “map” — this is a modern and narrow definition that cannot be rightly projected onto the past. Surviving maps such as the colorful Black Sea map of Dura Europos from around the mid-third century CE and the late antique Tabula Peutingeriana may not always have been functional, or consistent in time or scale, but they were indeed maps that could communicate routes, power, and dominion.
As is the case today, the ways in which we abstract and then represent data — even at the level of a watch face or a pie chart — speak to the ways in which our minds have been trained to read, systematize, and process data. Mosaics of Knowledge illustrates that the reading of these information technologies was often local rather than universal, and was not even always legible to many within the Roman Empire. The book is also a reminder of how graphic artists then and now have had to grapple with how to convey their messages in a way that could have utility while being aesthetically pleasing. The Roman world that Riggsby describes is a “tessellation” of contributions by myriad painters, intellectuals, bureaucrats, architects, and tradesmen who all created informational graphics that might serve their time, place, and data needs. Or perhaps their IT just provided a wealthy Roman with a flashy handheld sundial to show off on route to the baths.