
Art
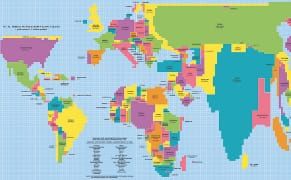
New Site for Data Visualization Lets You Share Statistics
From charts that show how swearing in public has changed over time to a graph tallying the crimes that have put people behind bars in New York, a new site is aiming to make data visualization more accessible and shareable.


