Celestial Spheres, Smog Charts, and Radial Cartography in a New Book About Circles
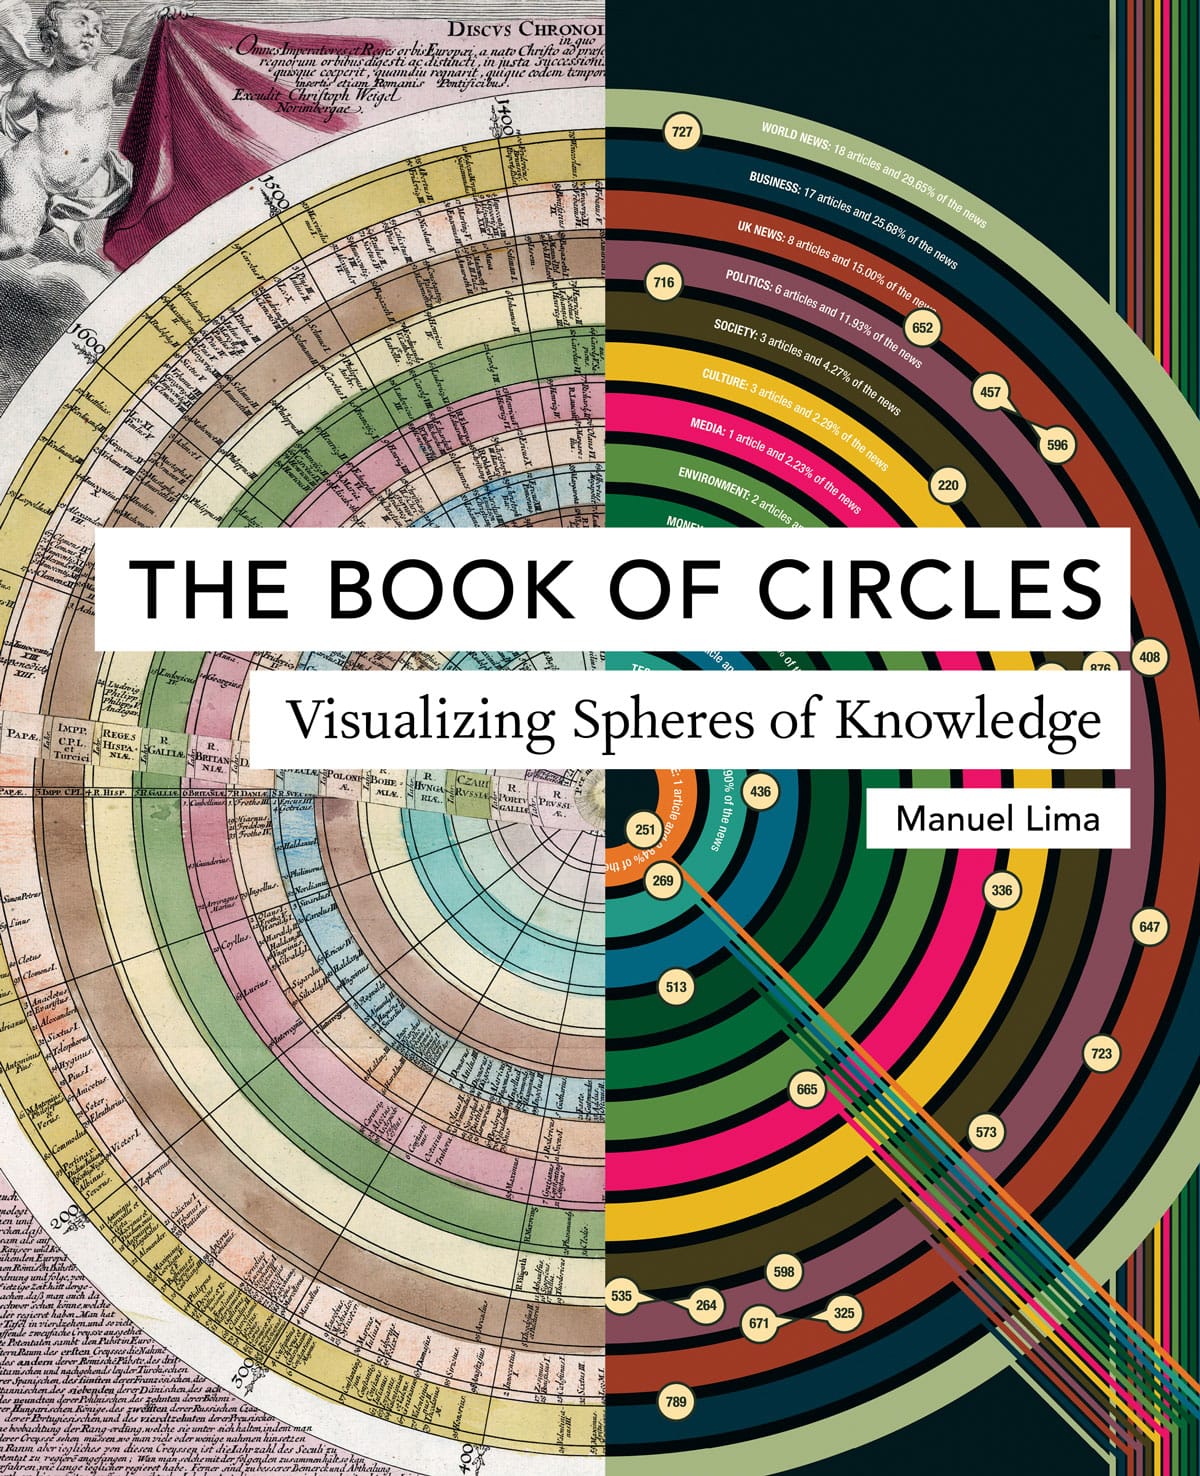
Manuel Lima's The Book of Circles explores centuries of circular visual expression, from representations of infinity to maps of the stars.

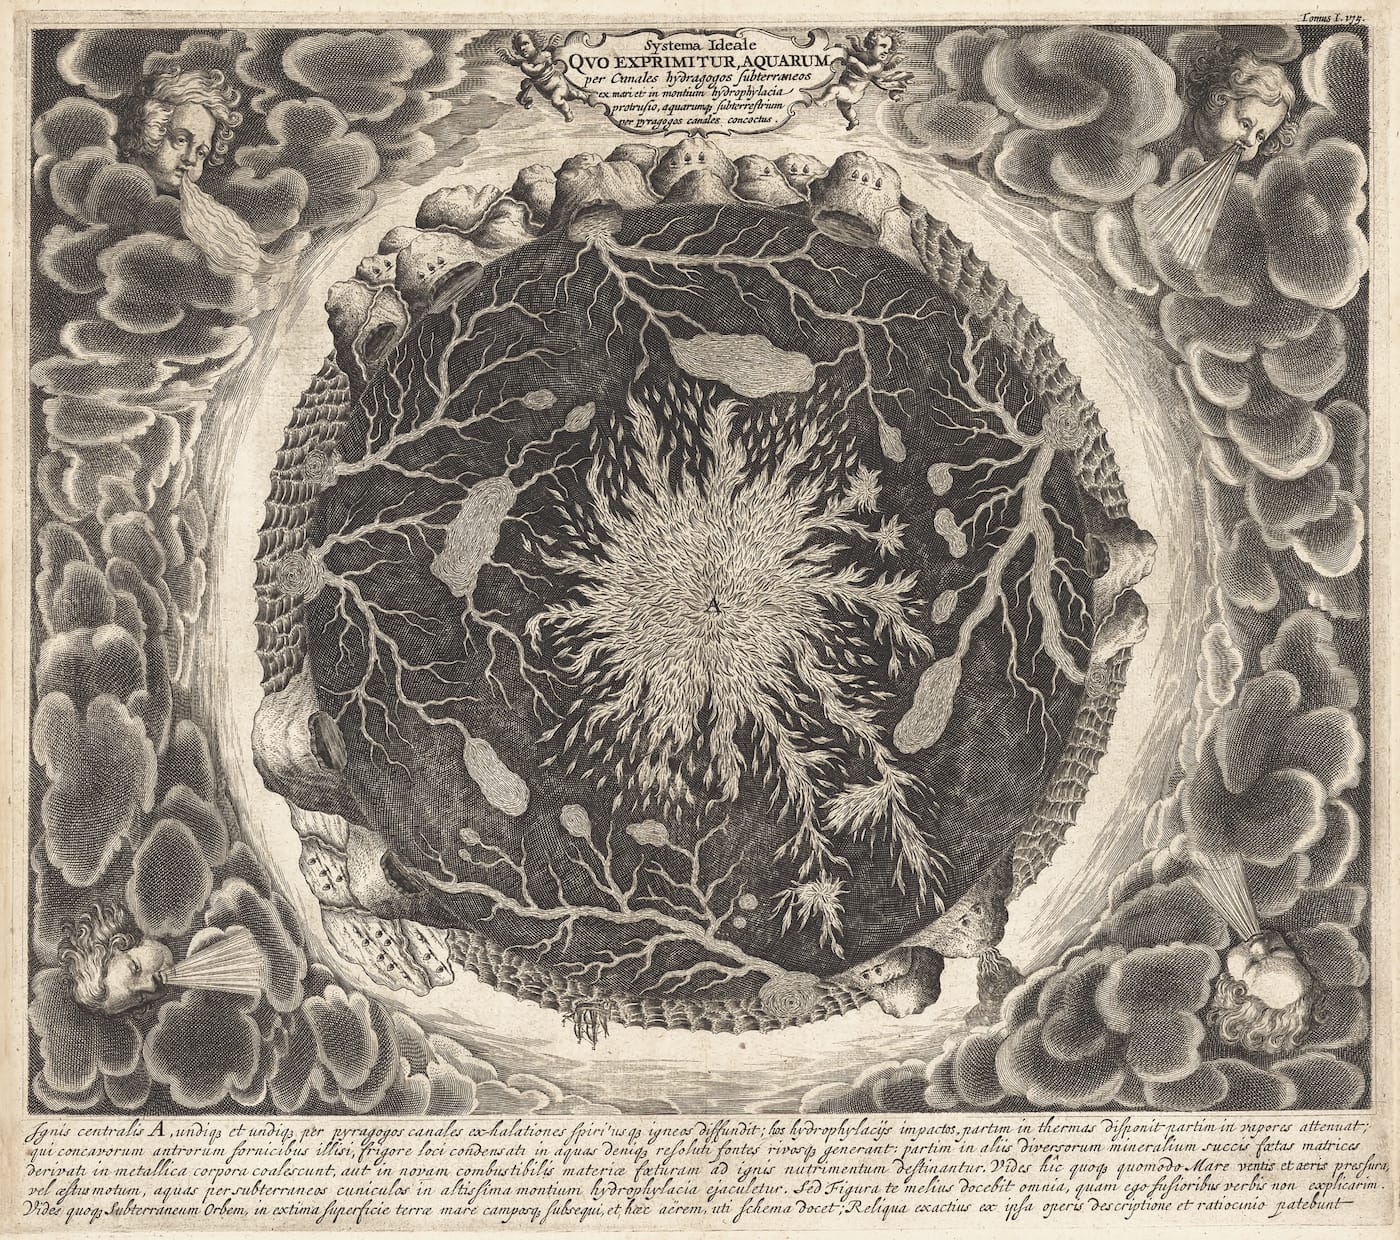
Across the centuries, around the world, humans have loved circles. Perhaps because that planet which we call home is a sphere, or due to the moon’s non-Euclidean glow in the night, circles have frequented our written language, art, architecture, design (wheels!), even the way we stand when assembled. The Book of Circles: Visualizing Spheres of Knowledge by Manuel Lima, out now from Princeton Architectural Press, tackles the long history of the circle as a form of human expression.
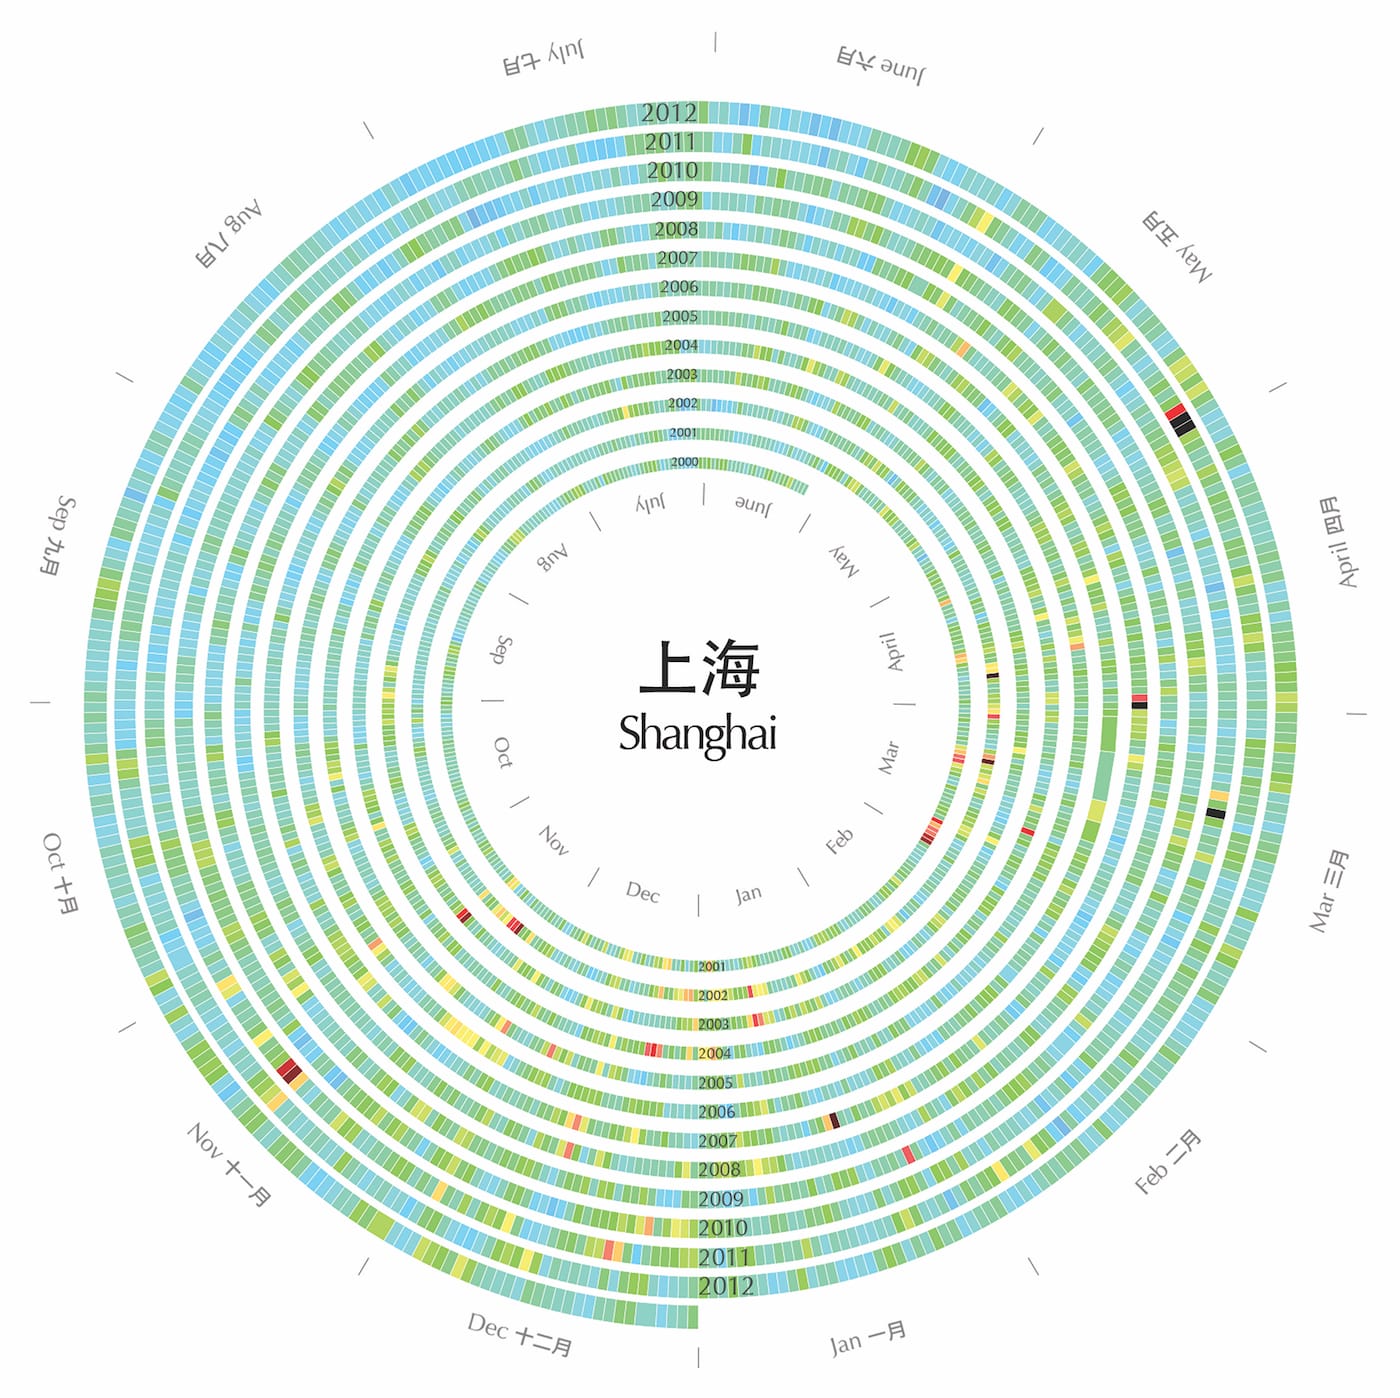
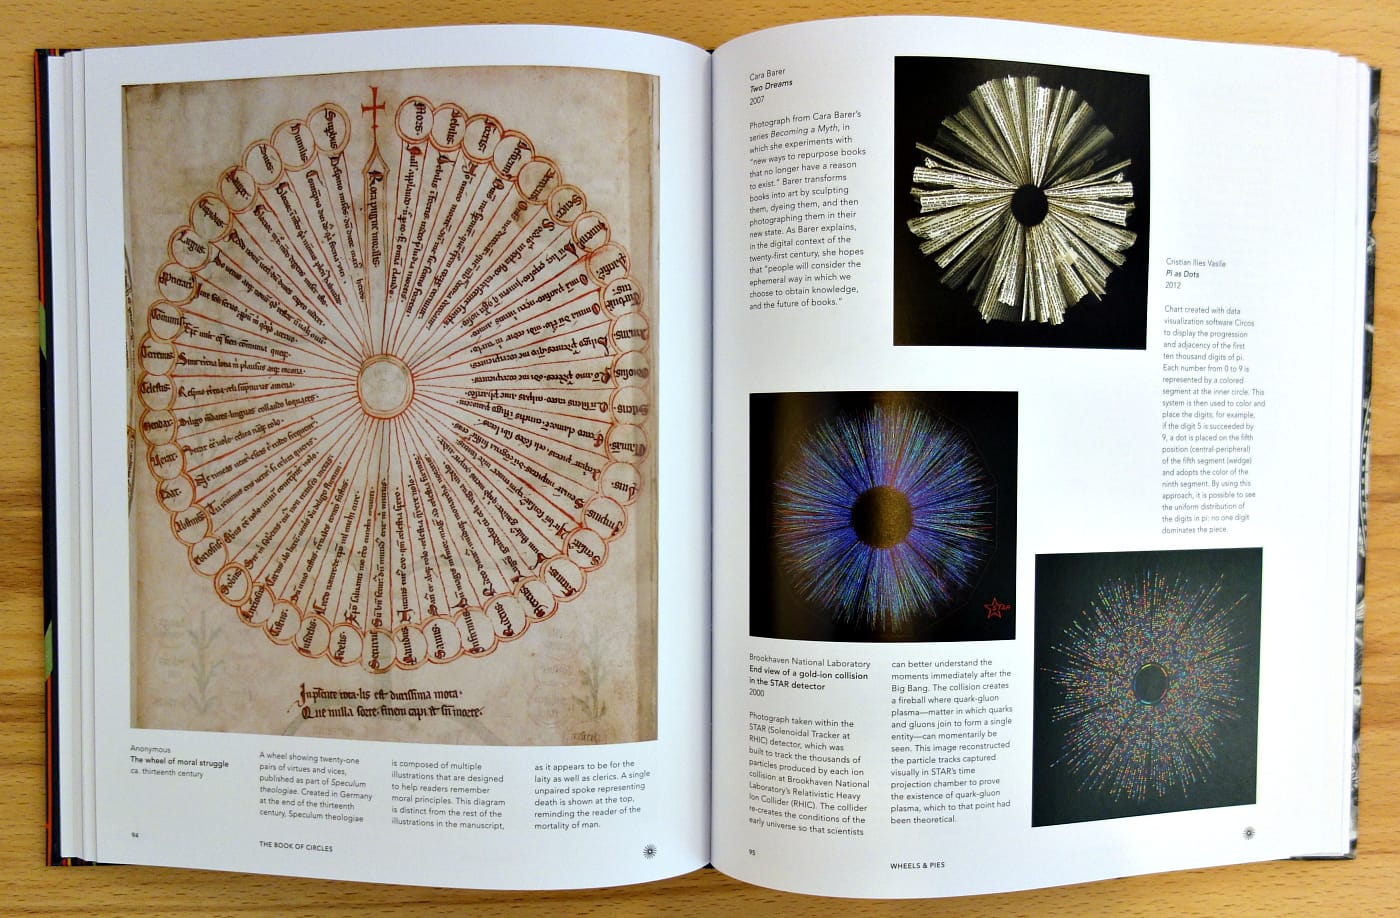
“Of all possible models and configurations — with endless possibilities for constructing diagrams and charts — why is the circular layout such an exceptionally popular choice for depicting information?” asks Lima his preface. The book is follows his 2014 The Book of Trees: Visualizing Branches of Knowledge, and his online VisualComplexity.com where he explores data visualization projects. The circle, in its ubiquity, is a much broader theme than the tree, and the over 300 illustrations in The Book of Circles vary from a 13th-century wheel of moral struggle from Germany, to Xiaoji Chen’s 2013 “Sky Color of Chinese Cities” representing air pollution data.
“Used to represent a wide range of ideas and phenomena pertaining to almost every domain of knowledge the circle became a universal metaphor embraced by virtually every civilization that has ever existed,” writes Lima in a book essay. “A closer look at human appropriations of the circle shows a continuous order, from the towns and urban areas we have built over the centuries to the household articles and tools we have designed to the written signs and symbols we have created to communicate with each other.”
Figure one in the book is Galileo Galilei’s 1610 moon drawing, notable as his discoveries related to heliocentrism certainly influenced the spherical knowledge of our Earth. It’s followed by star charts, city maps, compasses, weather radials, atlases, and an array of contemporary data visualization. Some of the page layouts are more conceptual, like a photograph by David Stephenson of the 18th-century Basilica of Superga dome contrasted against a 2008 view of the Large Hadron Collider. Bryan Nash Gill’s 2011 “Cedar Pole,” part of his series of dead tree reliefs, uses its concentric rings as a natural chart of time. Elsewhere, there are examples of the many ways circles can express data, such as a 1680 zodiac chart by alchemist and astronomer Nicholas Flamel alongside a 1903 chart of “Death rates from accidents, injuries, and suicides” by Henry Gannett, using the circle as a calendar of constant mortality.
Lima breaks down these infographics into a taxonomy of 21 distinct types, organizing the book around these patterns. Whether a 1527 fortification plan by Albrecht Dürer, or the ouroboros symbol of infinity and death, The Book of Circles embraces every iteration of cyclical design. “If an all-encompassing framework for visual language is seemingly unattainable, a collection of smaller taxonomic efforts targeting discrete archetypes seems considerably more achievable,” Lima writes. “This book constitutes a single step toward that goal by focusing on the diverse manifestations of one of the most universal and long-lasting visual metaphors: the circle.”
The Book of Circles: Visualizing Spheres of Knowledge by Manuel Lima is out now from Princeton Architectural Press.