Not Just Bushwick: New Study Charts Where NYC Artists Live
While the artist population in Manhattan is in decline, the number of artists in the Bronx nearly doubled since 2000.

Whether you like it or not, Bushwick is famous today for being a neighborhood of artists. That reputation grew fast, and a new statistic shared by the Center for an Urban Future (CUF) offers some concrete numbers to help understand why and how: Bushwick’s artist population, between 2000 and 2015, increased by a whopping 1,116%.
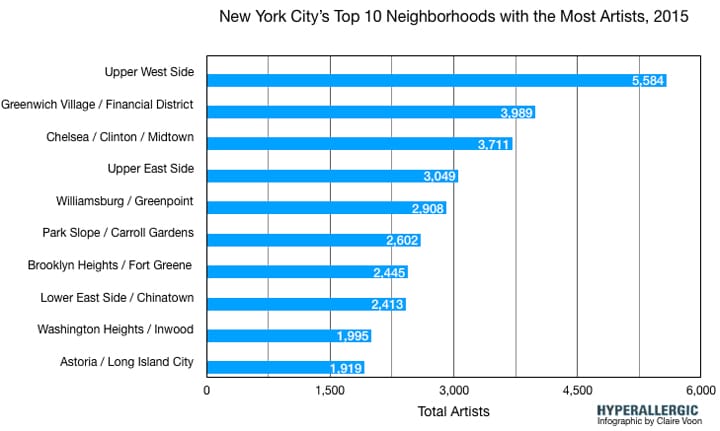
At the start of this century, 150 artists lived in what was then a very industrial area; 15 years later, 1,824 called the neighborhood home. Meanwhile, Manhattan districts long known as artist havens lost creative individuals over that same period of time: The collective artist population of Chelsea, Hell’s Kitchen, and Midtown, for instance, dropped 28%, from 5,178 to 3,711.
Those are just a few of the fascinating details from CUF’s report, “Artists in Schools: A Creative Solution to New York’s Affordable Space Crunch,” which was released today. As the title suggests, the report’s chief agenda is to propose that artists use existing school facilities as studio space in the face of citywide rising rents. But its writers, Adam Forman and Matt A.V. Chaban, preface their solution with a highly informative neighborhood-by-neighborhood breakdown of where artists live now. The data reveals the shifting landscape of New York’s arts community over 15 years, based on numbers from the US Census Bureau’s 2015 American Community Survey.
Despite the challenges artists face when it comes to securing apartments, studios, and practice spaces, New York City, in 2015, was home to a record number of artists: 56,268, which marked a 17.4% increase from 2000. (Forman, that year, published a study emphasizing how the city’s cultural sector was thriving). While Manhattan still reigns as the borough with the most artists, it saw a 10% decline to 26,650 between 2000 and 2015. Unsurprisingly, areas that lost the most were the West Village, Tribeca, and the Financial District, with a 24% collective decline to 5,234; and the Lower East Side, which lost 17% of its artists, leaving 2,413 residents in 2015.
But Manhattan, that year, was still home to the neighborhood with the most artists: the Upper West Side, which witnessed a 2.5% increase to 5,584. The report notes that one of the biggest upswings occurred in Central Harlem, where the number of artists went up 216%, to 956.
Some Manhattan artists may have left the city, but many just left the island. Every other borough witnessed a rise in its artist population, most significantly Brooklyn, where the number of artists increased by 72% to 17,605. Brooklyn, in 2015, was home to seven of the top 10 neighborhoods that saw the largest jump in artists, with Williamsburg and Greenpoint collectively coming in second after Bushwick (with a 75% increase to 2,908), followed by Brooklyn Heights and Fort Greene (with a 58% increase to 2,445). Notably, Forman and Chaban write that the region encompassing Williamsburg and Greenpoint may have “reached ‘peak artist’: its artist population hit an all-time high of 2,986 in 2014 and then dropped by 78 residents over the following year.”
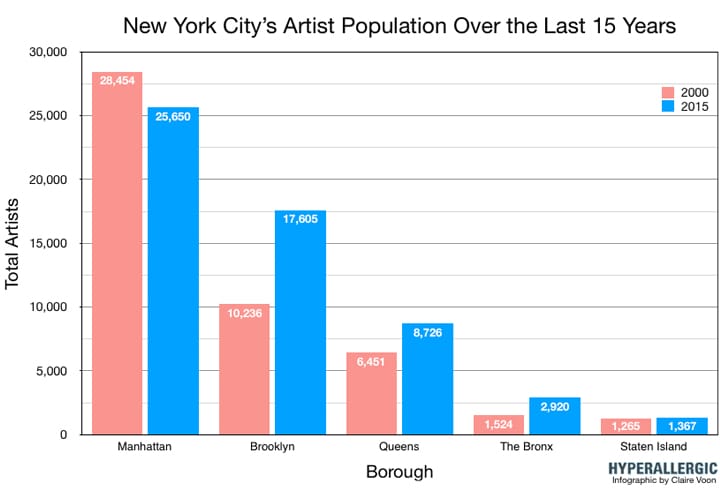
The jumps were sizable, too, in Queens and the Bronx. In the former, the number of artists increased 32% to 8,726 between 2000 and 2015, with Jackson Heights experiencing the largest growth of 176% to 618 artists. In the latter, the number of artists nearly doubled to 2,920, with Mott Haven in the South Bronx seeing a 43% increase to 288 artists, most of whom moved in over the last two years.
The growth in Staten Island was the smallest: just 8%, to 1,367.
With this spread across the city comes increased challenges to find artistic spaces that are both affordable and convenient to commute to. The second half of the report argues for the repurposing of art spaces in school buildings after school hours as studios, art venues, and performance spaces. Many of these rooms are also empty on weekends, and, as the report’s figures demonstrate, the city is replete with them.
“There are 1,456 visual arts rooms, 1,439 music rooms, 1,412 theater spaces, 1,425 dance studios, and 1,415 film production and editing facilities in the Department of Education’s 1,800-plus schools,” Forman and Chaban write. “After school hours, most are unoccupied — except for storage. Opening up these spaces to local artists could help address the massive need for studio space while strengthening arts education and exposure in neighborhoods and schools that could benefit enormously from a more deeply embedded arts community.”
Many of the neighborhoods with substantial artist populations, they note, also boast a high density of school facilities. The authors acknowledge that putting this plan into effect will have to overcome economic and bureaucratic challenges, but it shouldn’t be impossible if city officials work with school administrations, local foundations, and nonprofits such as Spaceworks. With the Department of Cultural Affairs’s release of the first official citywide cultural plan later this month, it’s especially important now to think of creative solutions to the city’s affordability crisis and to better understand the numbers behind the diaspora of artists who are grappling with it.
Read the entire report here.