CIA Declassifies Maps from 75 Years of Surveillance
To mark the 75th anniversary of its Cartography Center, the Central Intelligence Agency (CIA) shares decades of declassified maps.

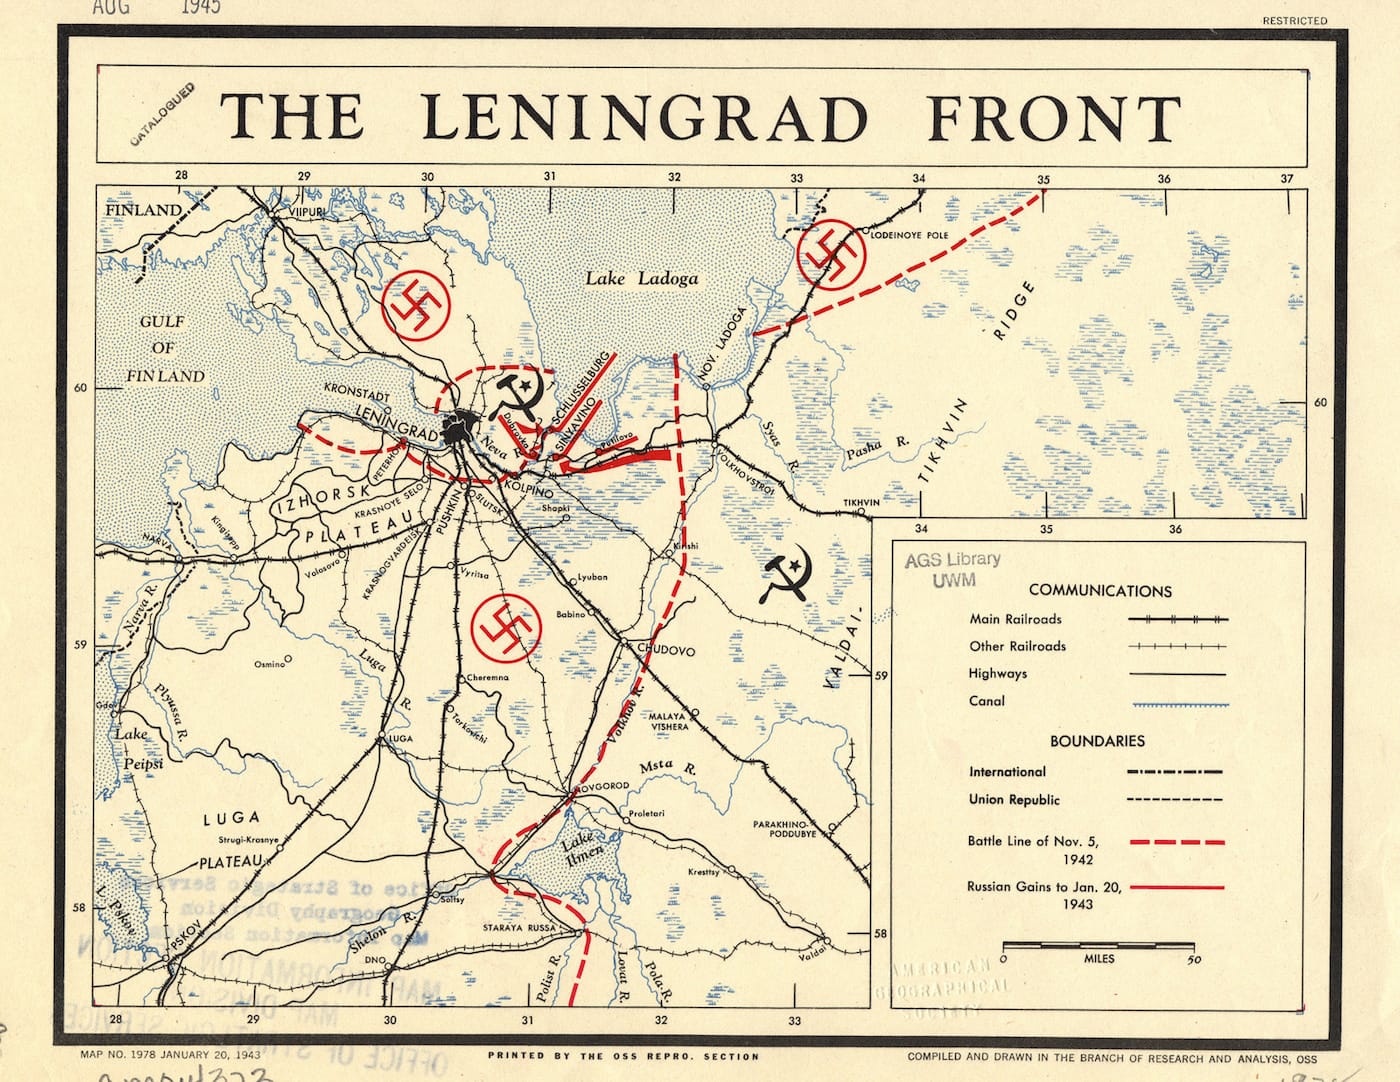
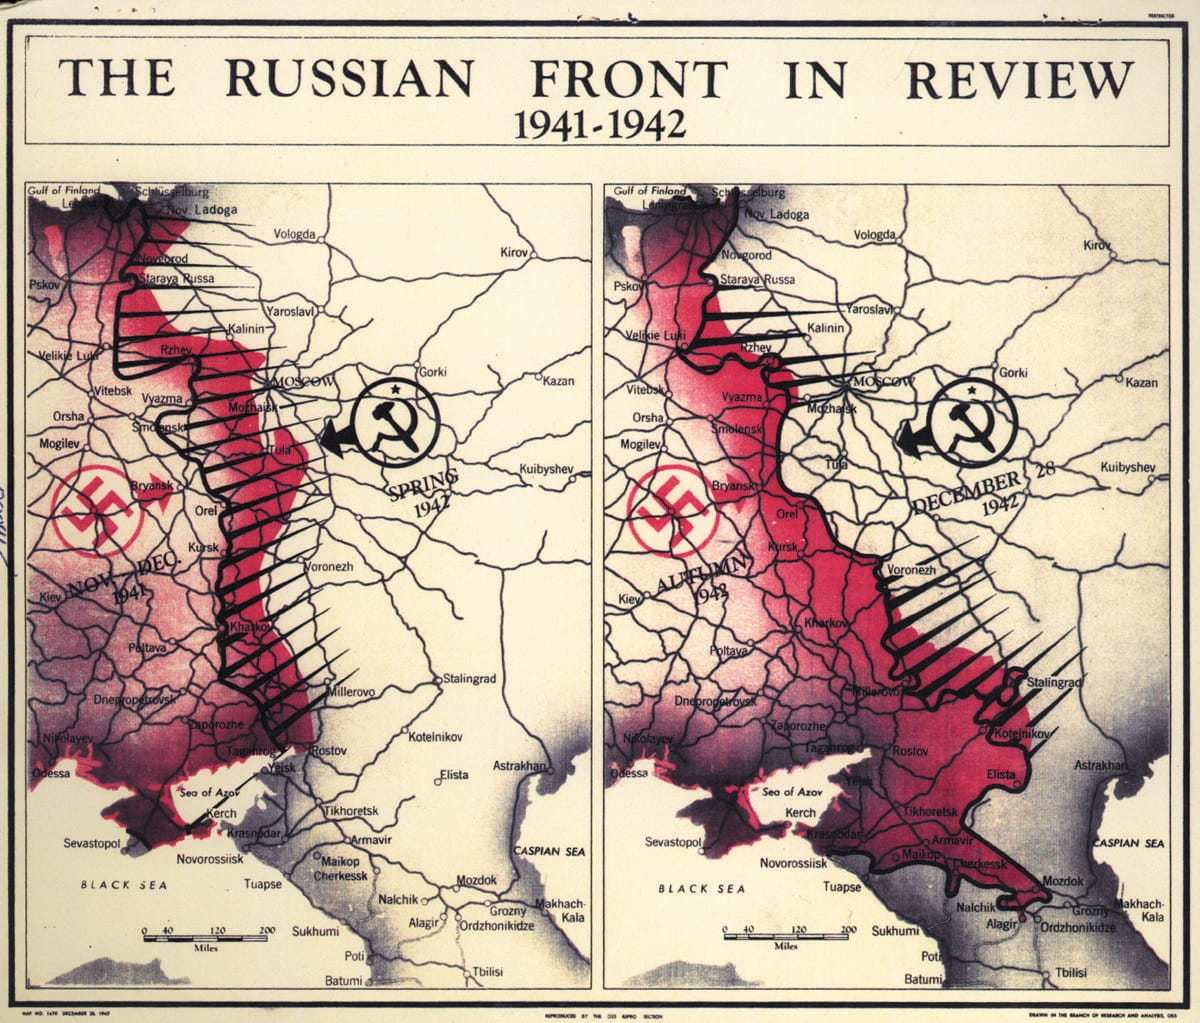
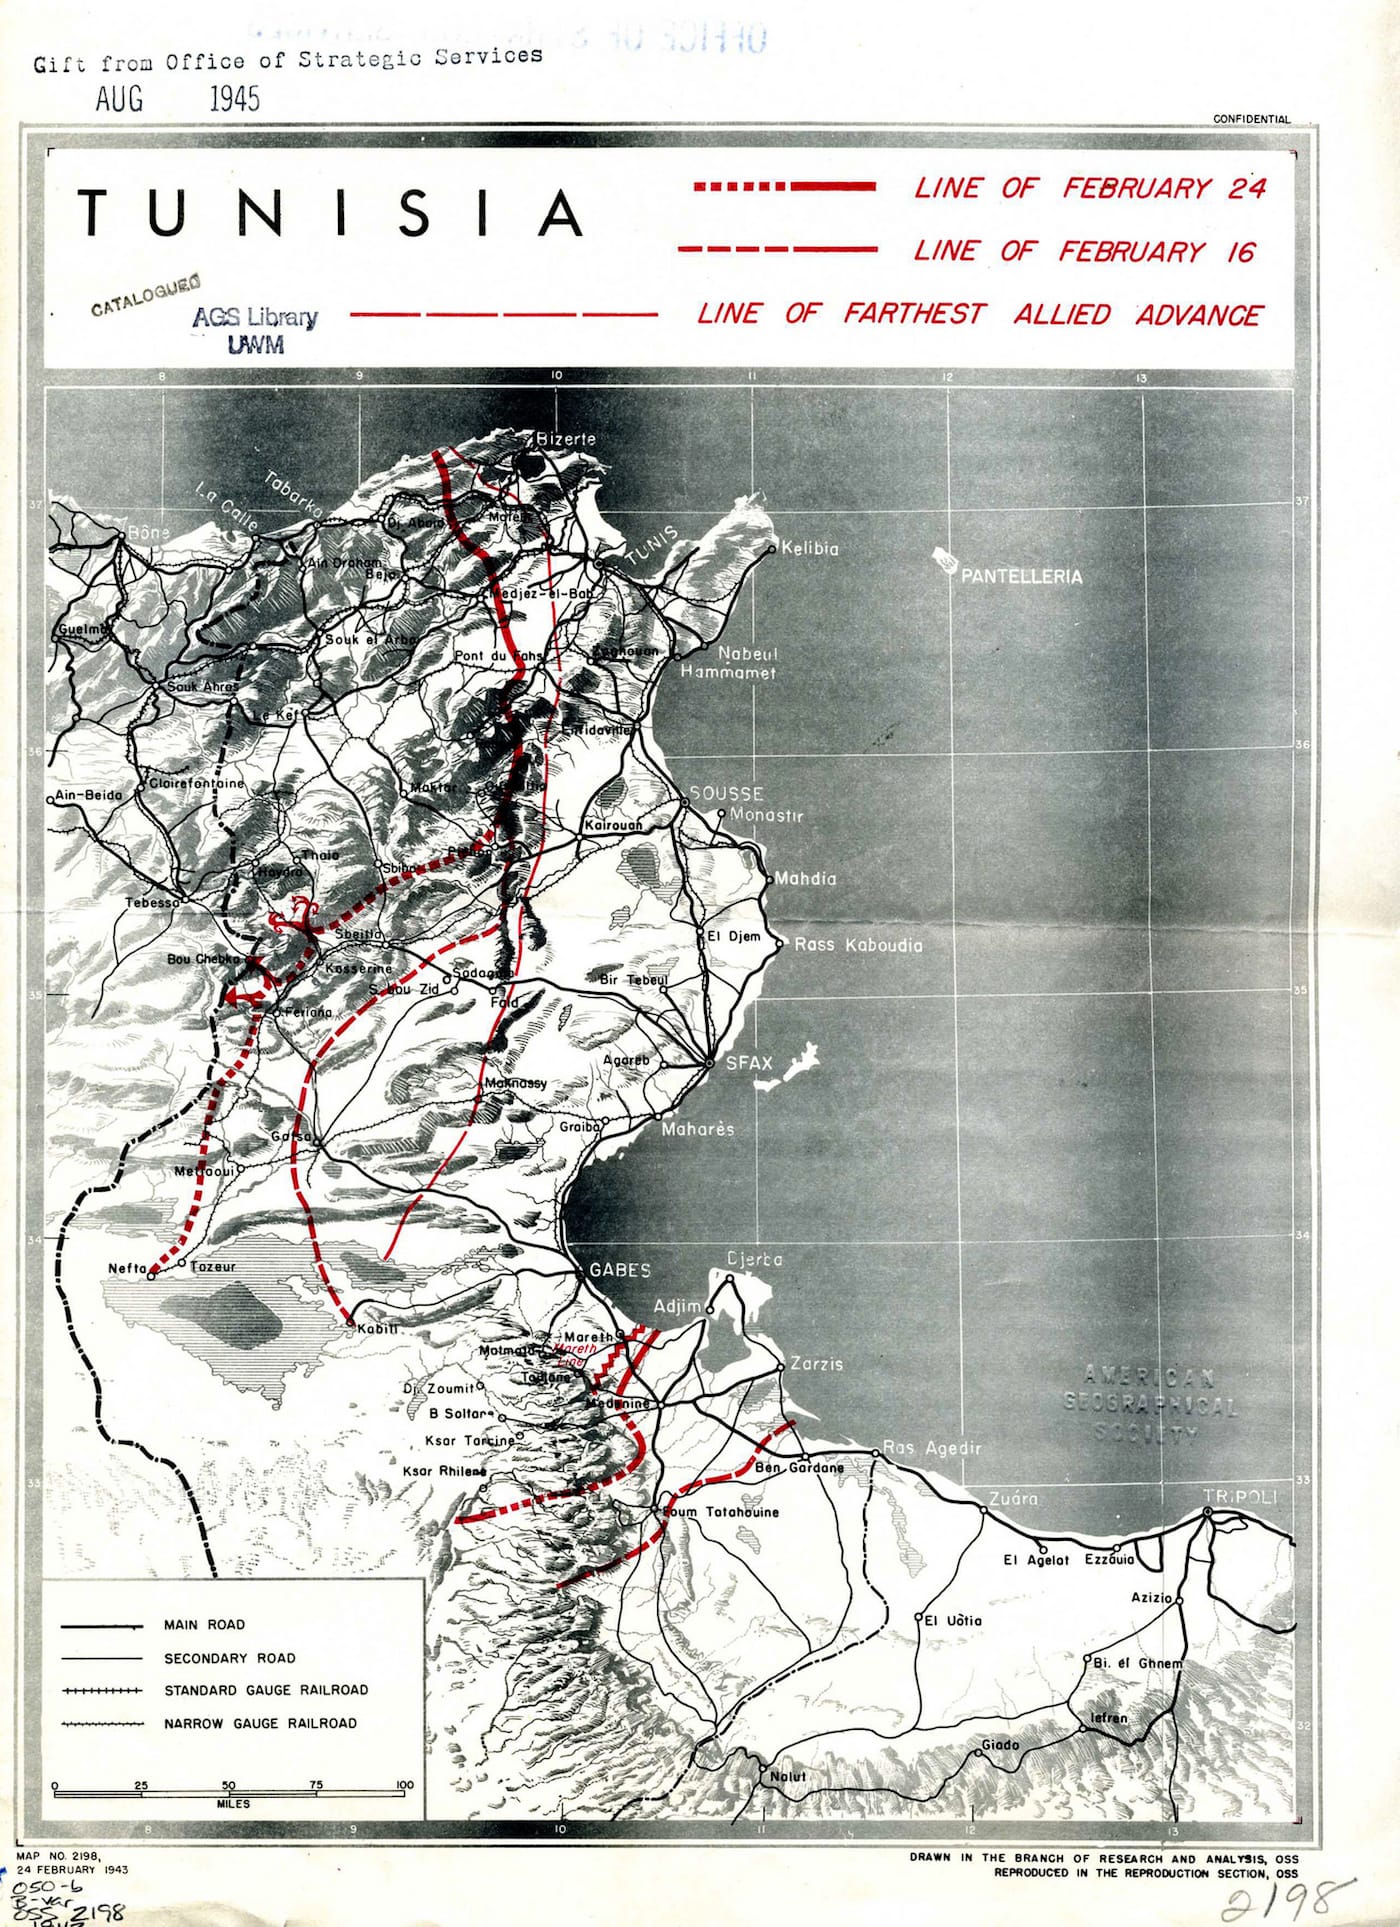
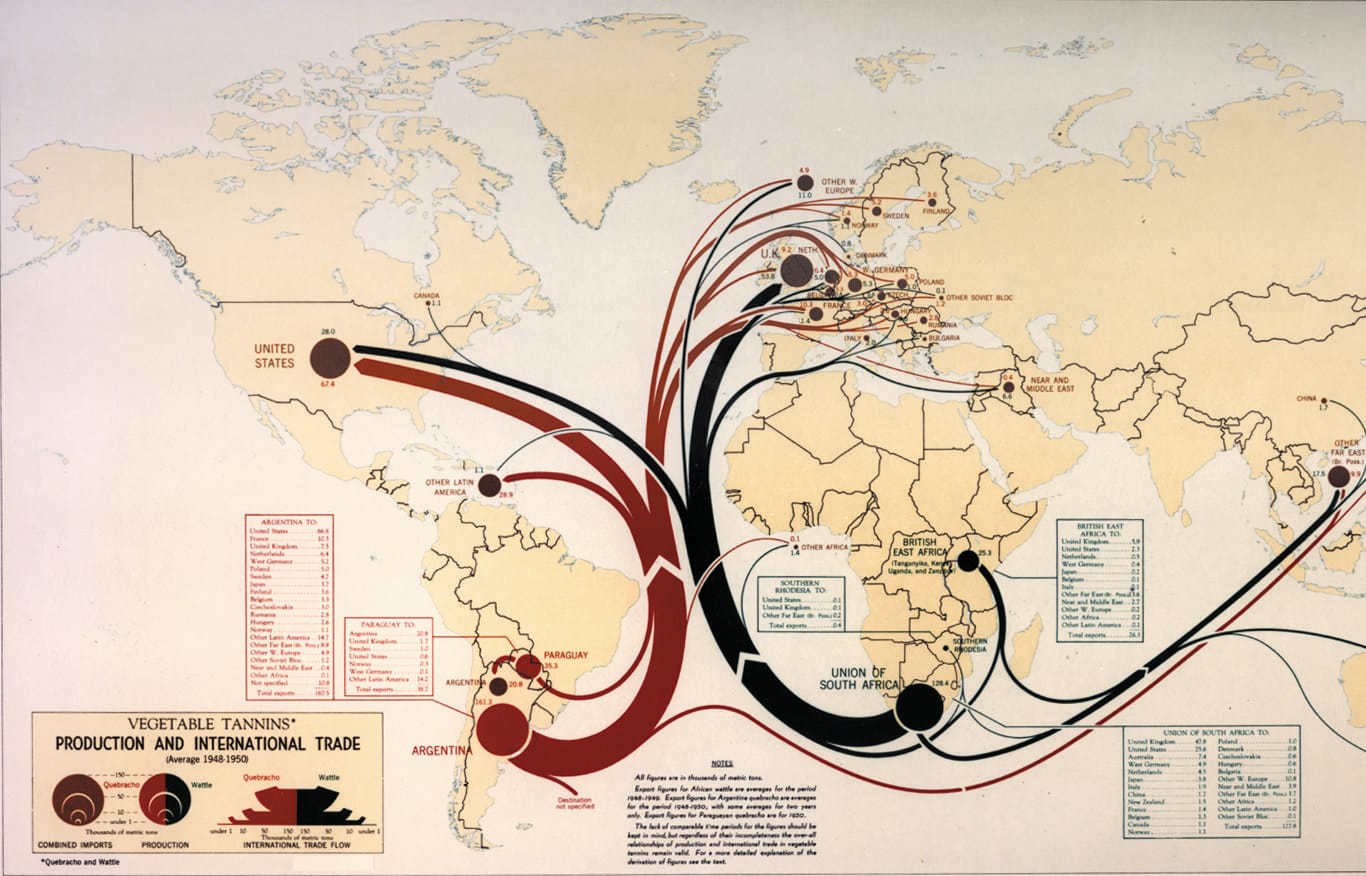
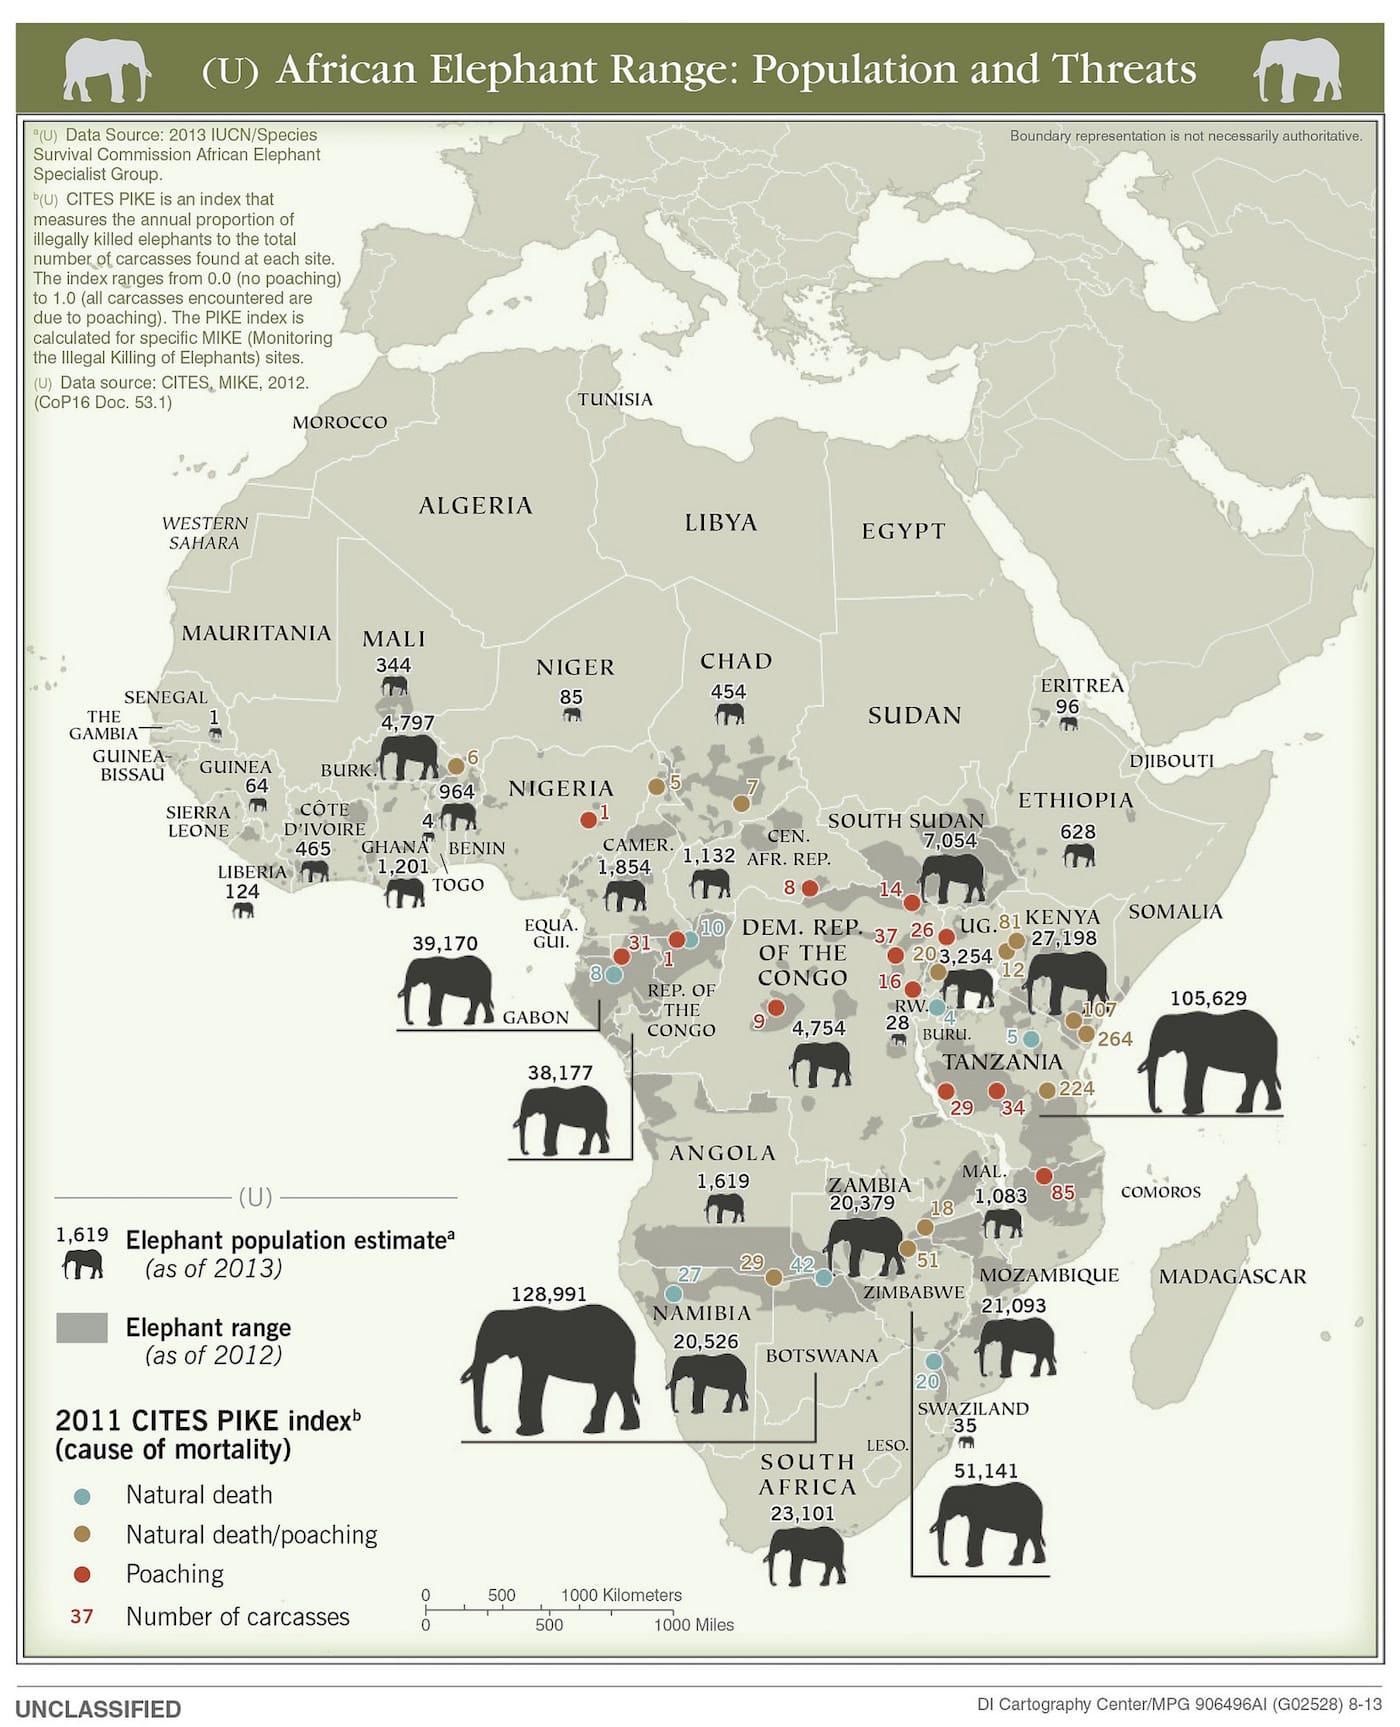
The Cartography Center of the Central Intelligence Agency (CIA) started in October of 1941 with hand-drawn maps that plotted the geographic data of World War II. The Center today harnesses more advanced, digital technologies, but the goal remains the same: to visually convey data in a way that will be understandable for a broad intelligence audience. For the Center’s 75th anniversary, the CIA announced last month that it was releasing several albums of declassified maps, which represent its decades of activity, onto Flickr. From the Russian front of 1942 to the threatened elephant populations of Africa in 2013, the maps are an archive of American involvement in global conflicts and crises.
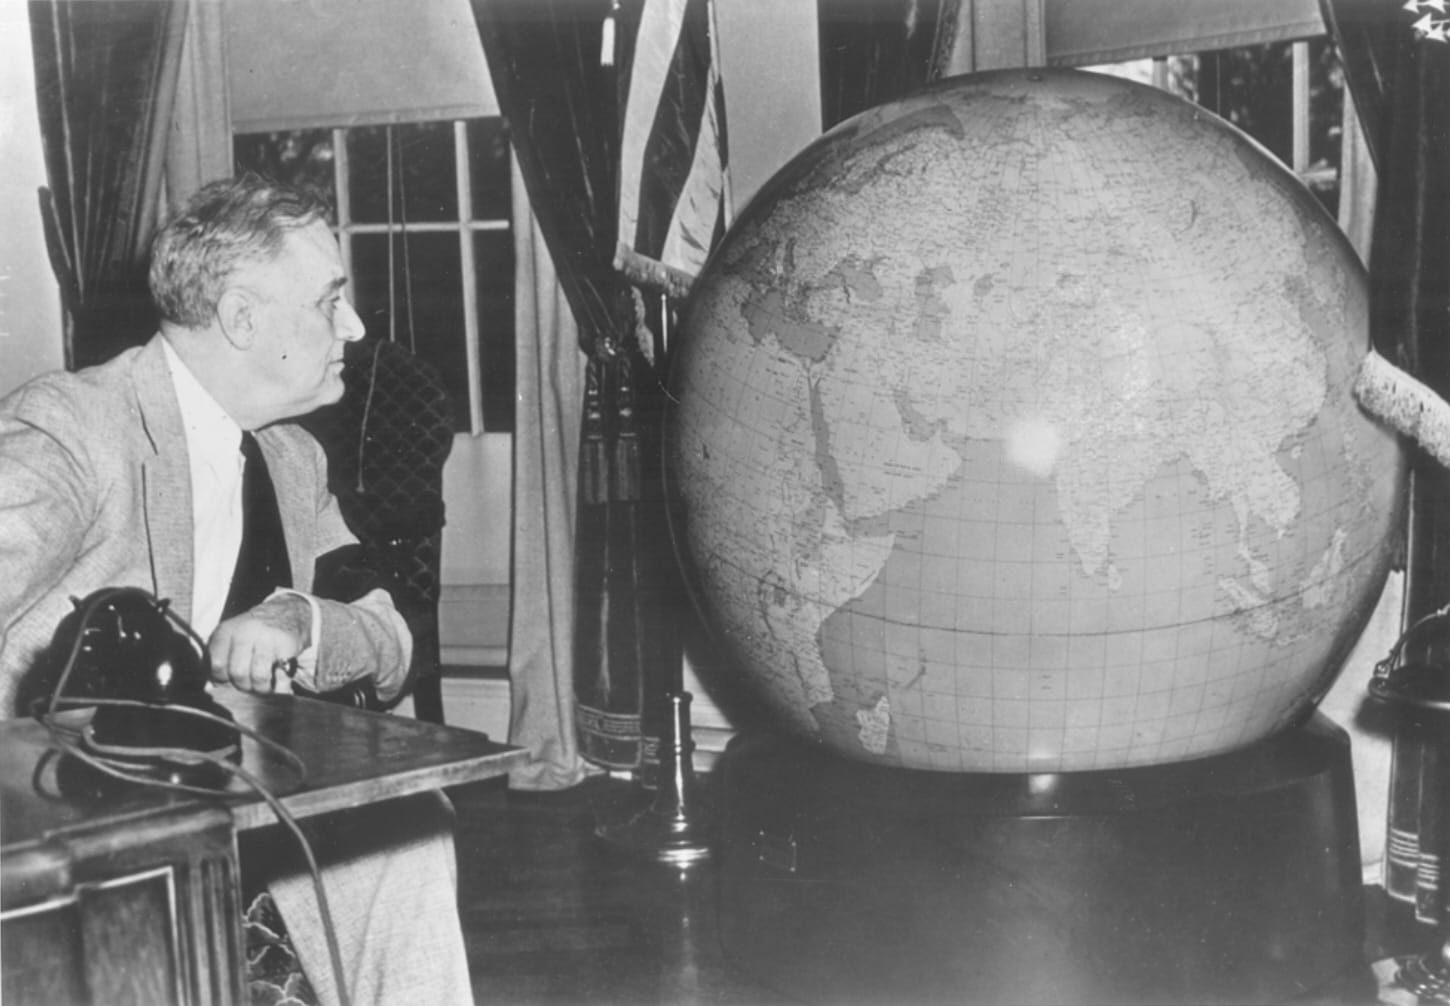
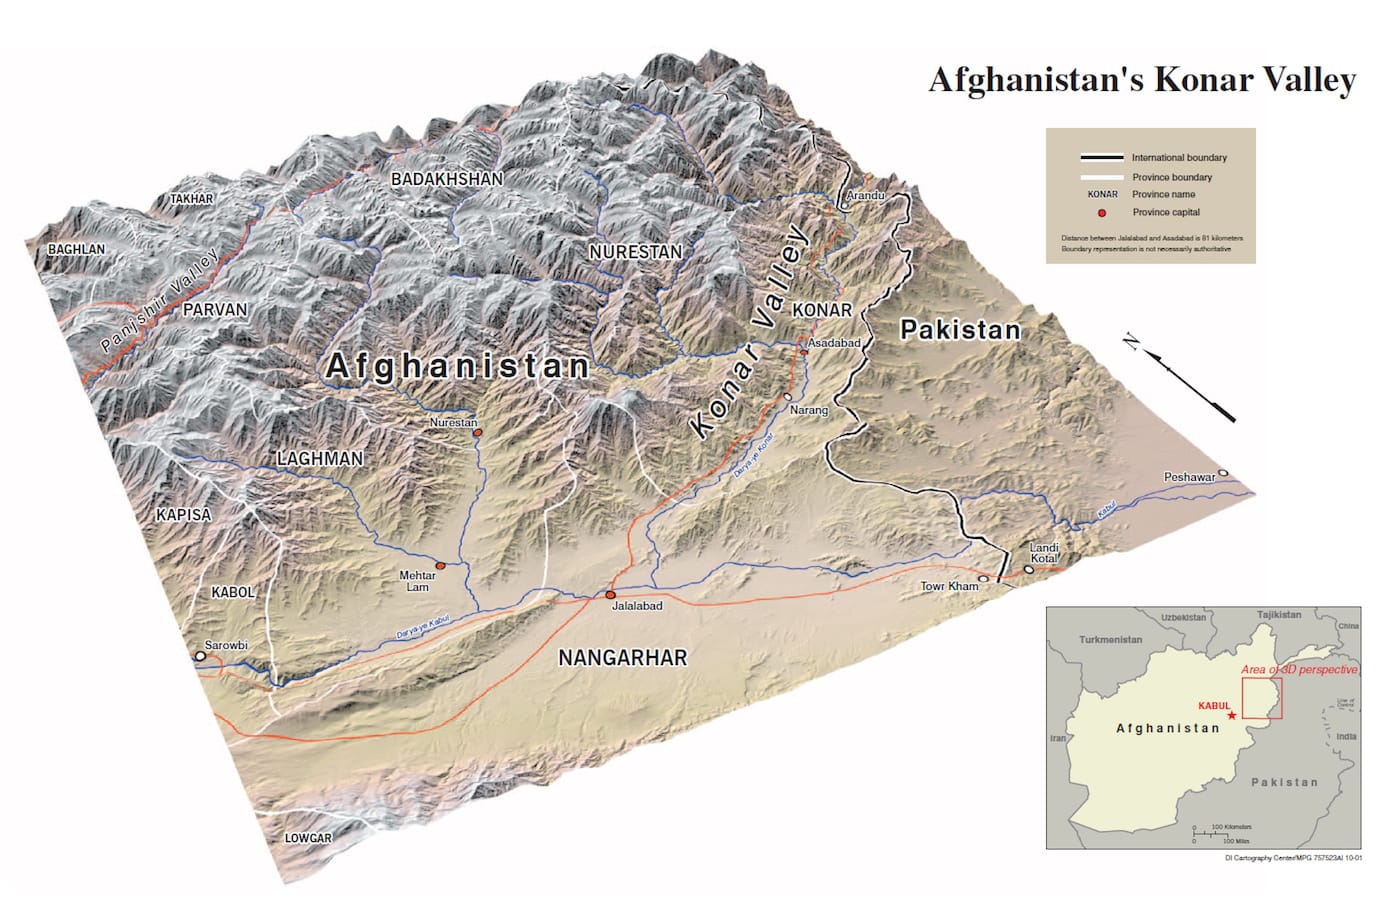
The CIA states on its site that the Center’s “chief objectives are to analyze geospatial information, extract intelligence-related geodata, and present the information visually in creative and effective ways for maximum understanding by intelligence consumers.” As Greg Miller at National Geographic noted, one of the images shows President George W. Bush and members of his staff viewing a CIA map on September 29, 2001, reflecting a period when the terrain and cartography of Afghanistan was surveyed ahead of the American invasion.
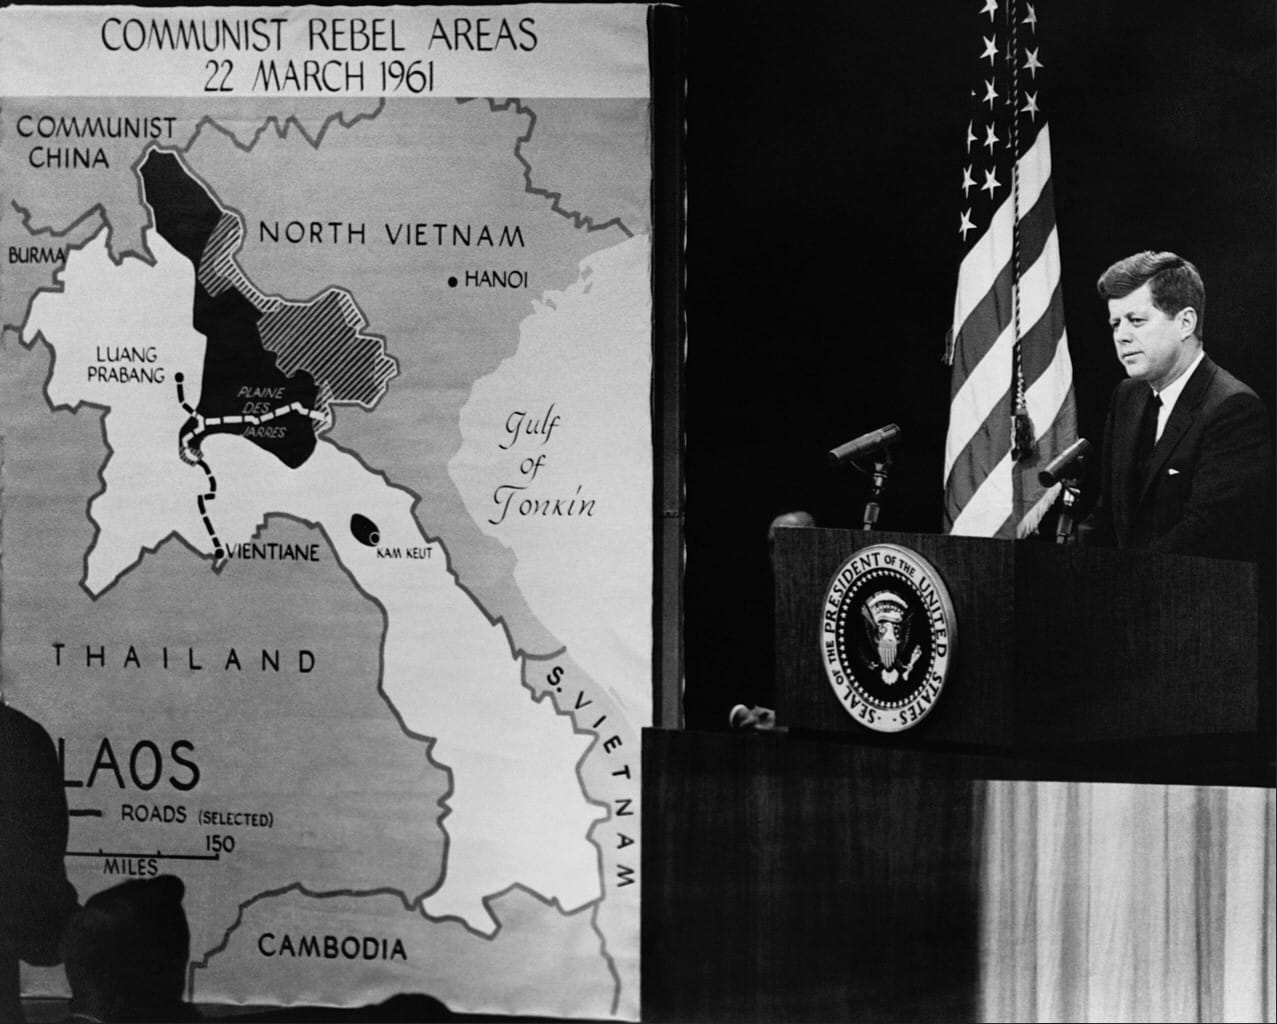
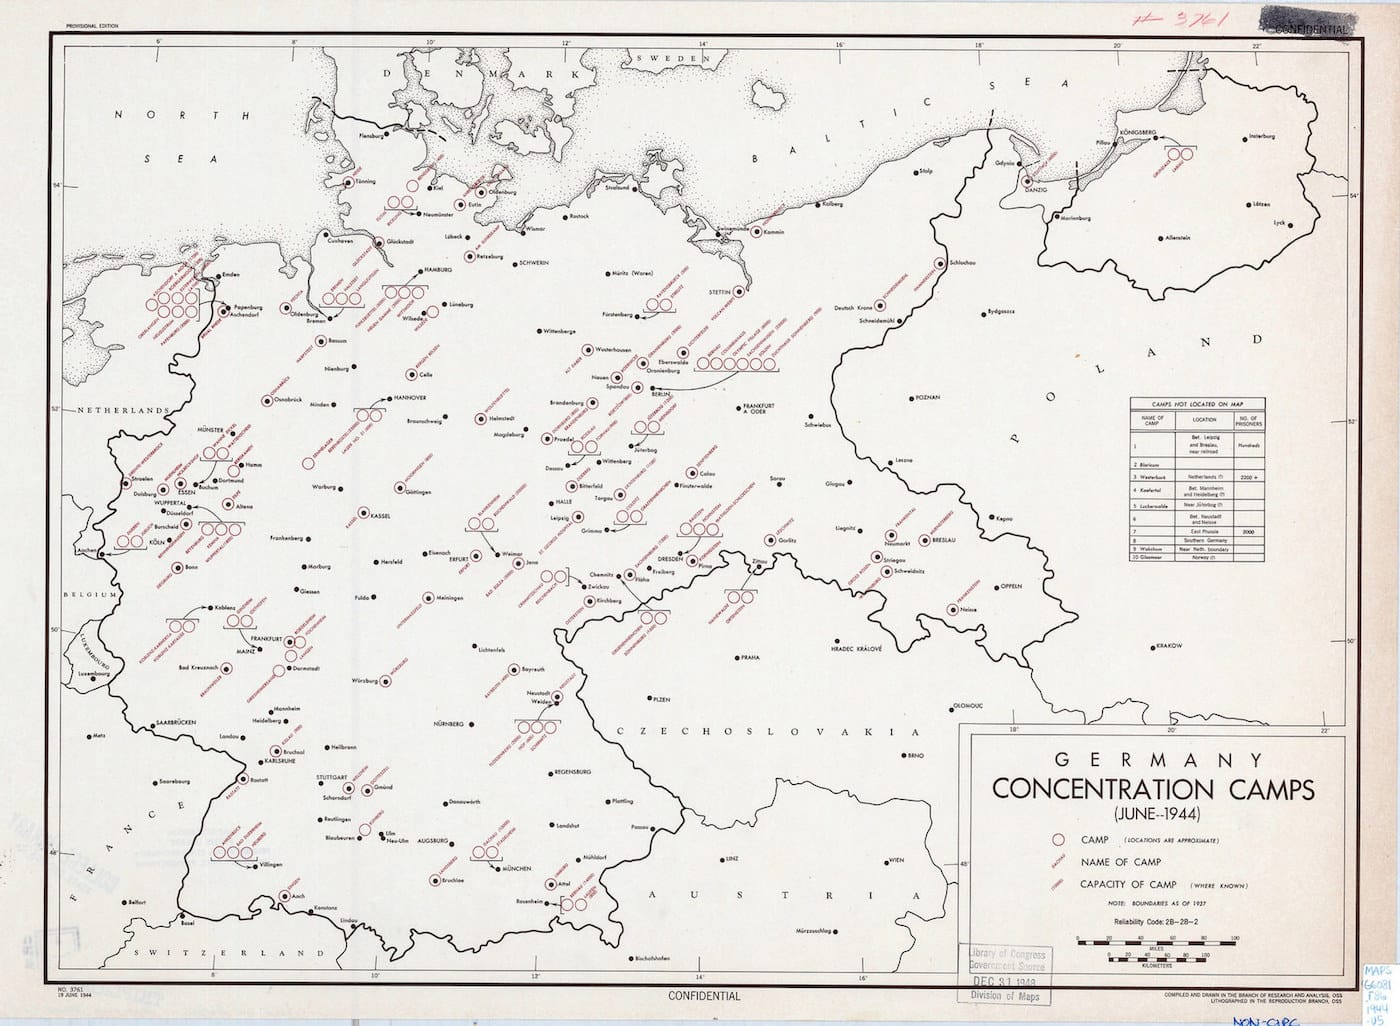
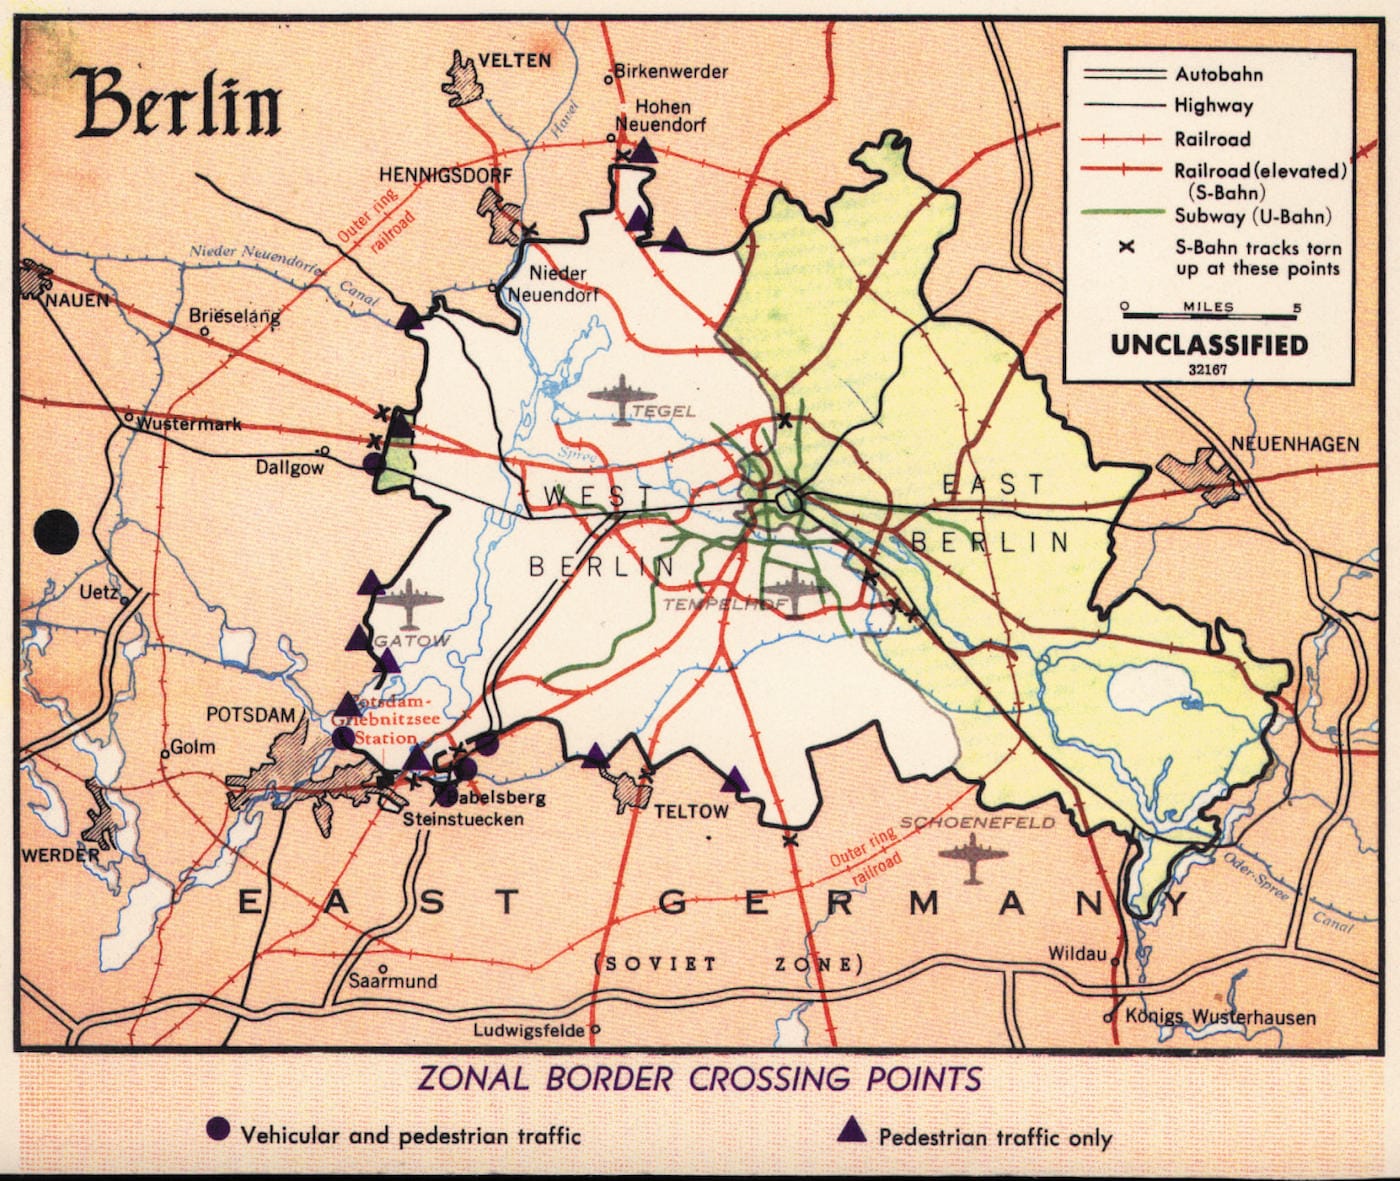
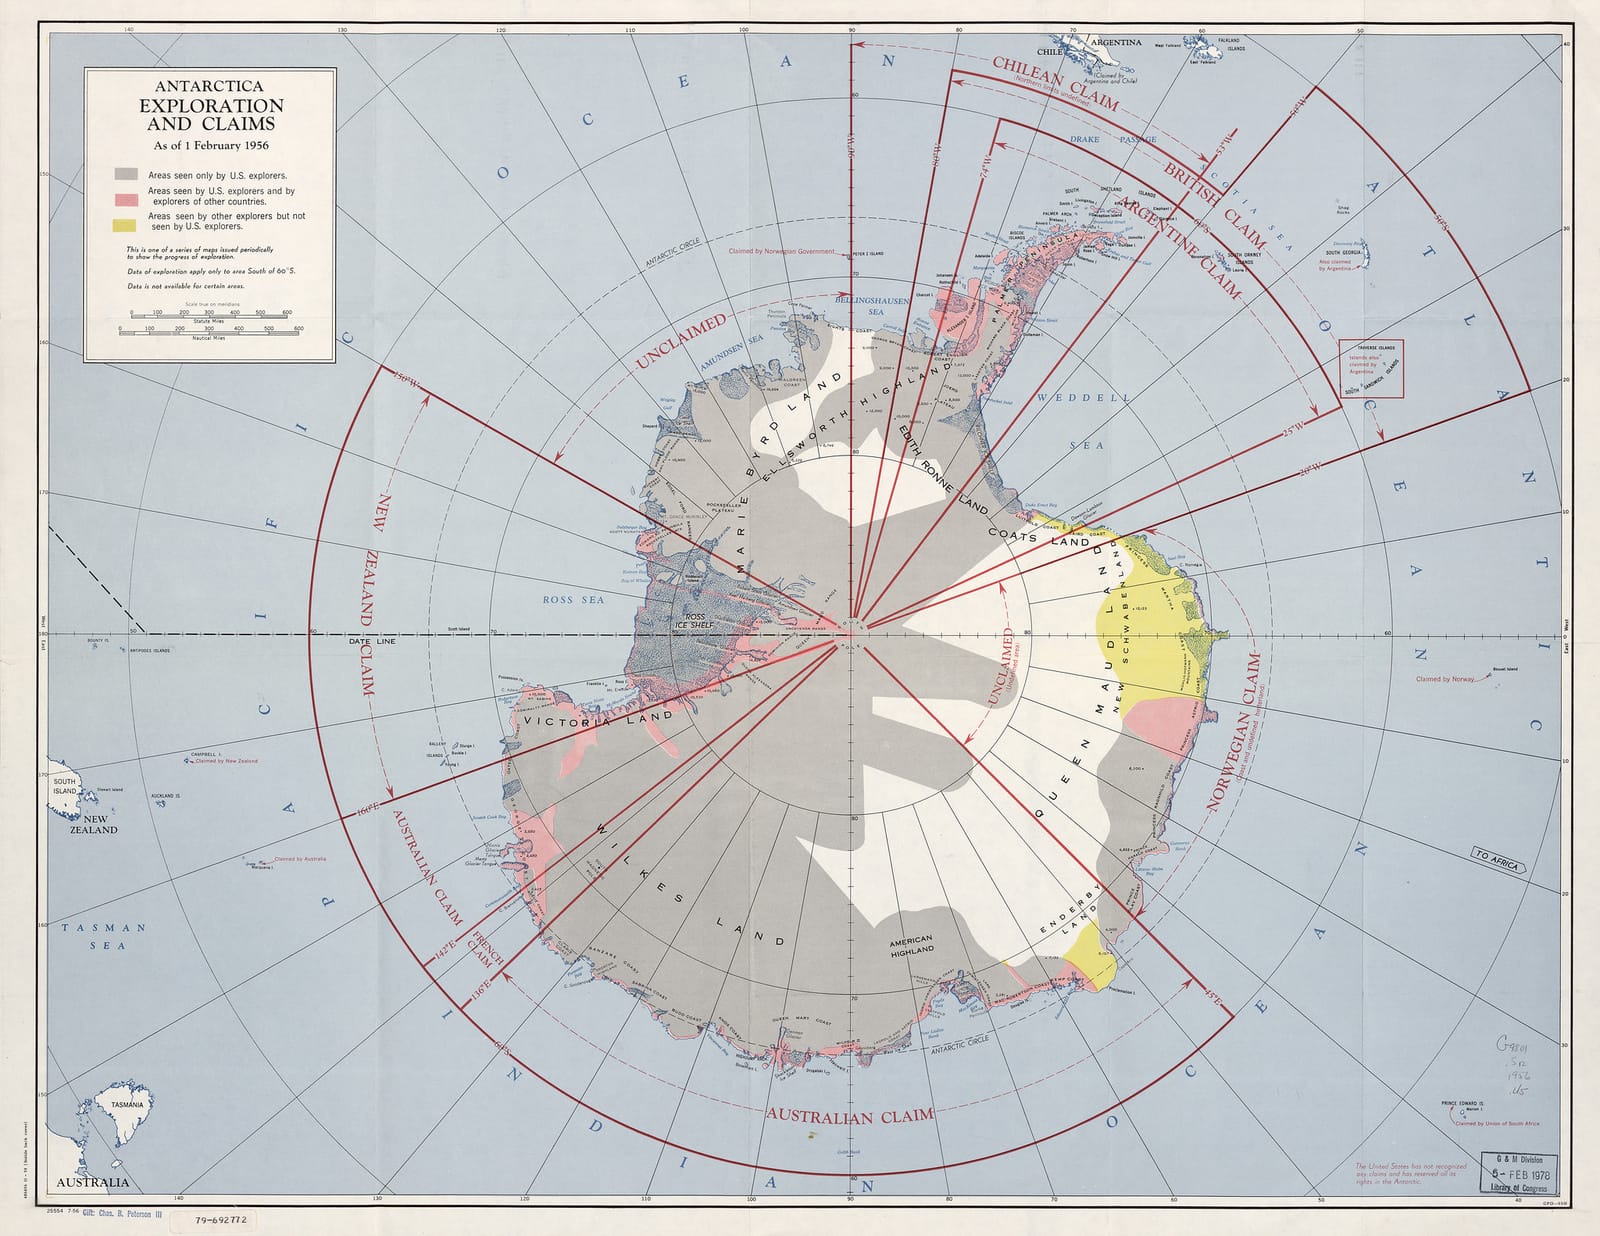
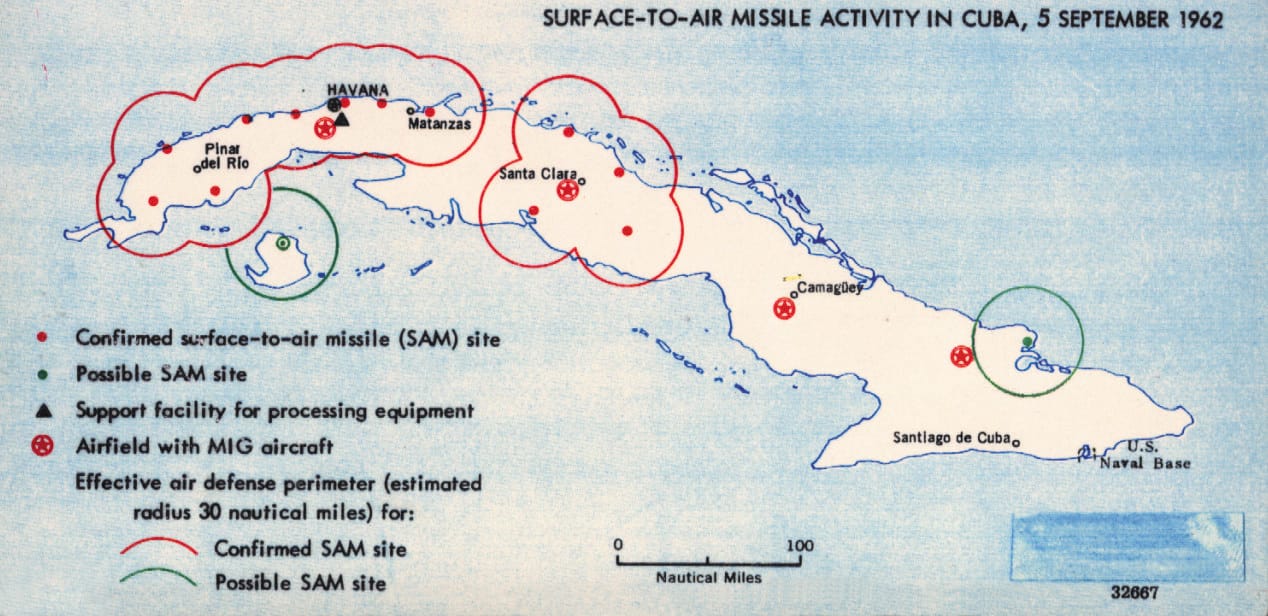
Likewise, each map is a time capsule of that era’s international issues. The 1940s include a 1942 map of German dialects, and a 1944 map of concentration camps in the country. The 1950s, with innovative photomechanical reproduction and precast lead letters, saw maps on the Korean War and railroad construction in Communist China. The 1960s are punctuated by the Cuban Missile Crisis and Vietnam War, while the 1970s, with increasing map automation, contain charts of the Soviet invasion of Afghanistan, and the Arab oil embargo.
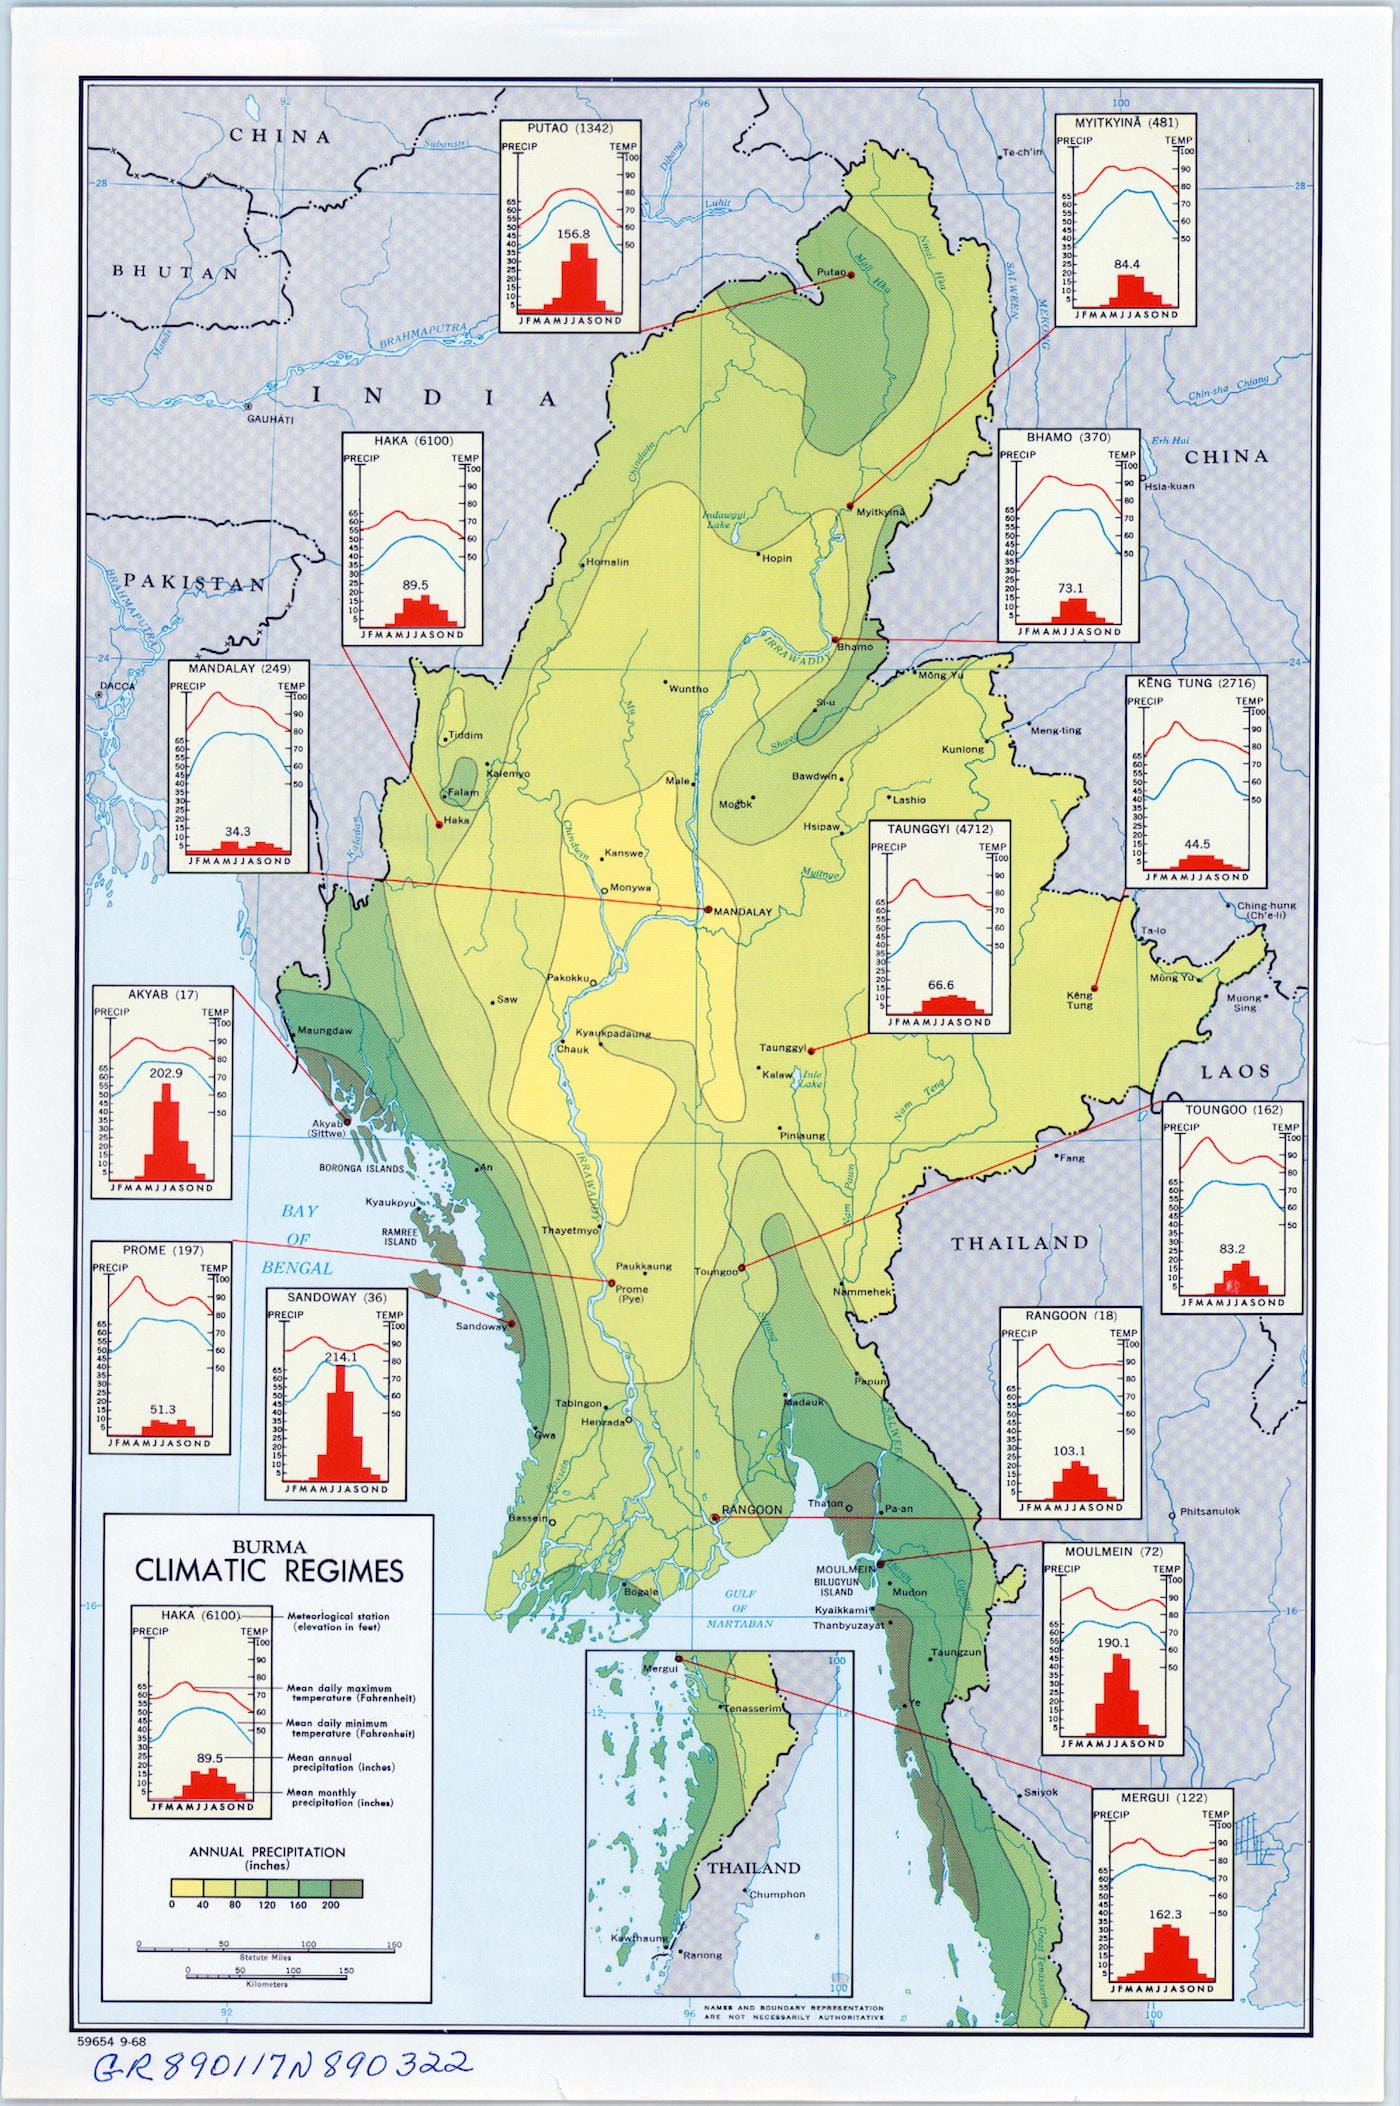
The 1980s maps involve the Falklands War and the Iran–Iraq War, while the 1990s, through newly sharp 3D perspectives and animations, have maps addressing African and Central American humanitarian emergencies, as well as the location of Weapons of Mass Destruction (WMDs). More recently, the 2000s digital maps analyze conflict in the Middle East and nuclear developments in Iran and North Korea, and 2010s maps examine the allocation of water resources in Mexico, and malaria risk in Southeast Asia.
“A map should be aesthetically pleasing, thought-provoking, and communicative,” stated the CIA Cartography Center’s founder, Arthur H. Robinson. And intelligence maps are a distinct design challenge, as they can influence governmental strategy and policy. However based on President-elect Trump’s disinterest in intelligence briefings, perhaps it’s time for the CIA to enter a new era of covert Tweeting for this administration’s cartography needs.
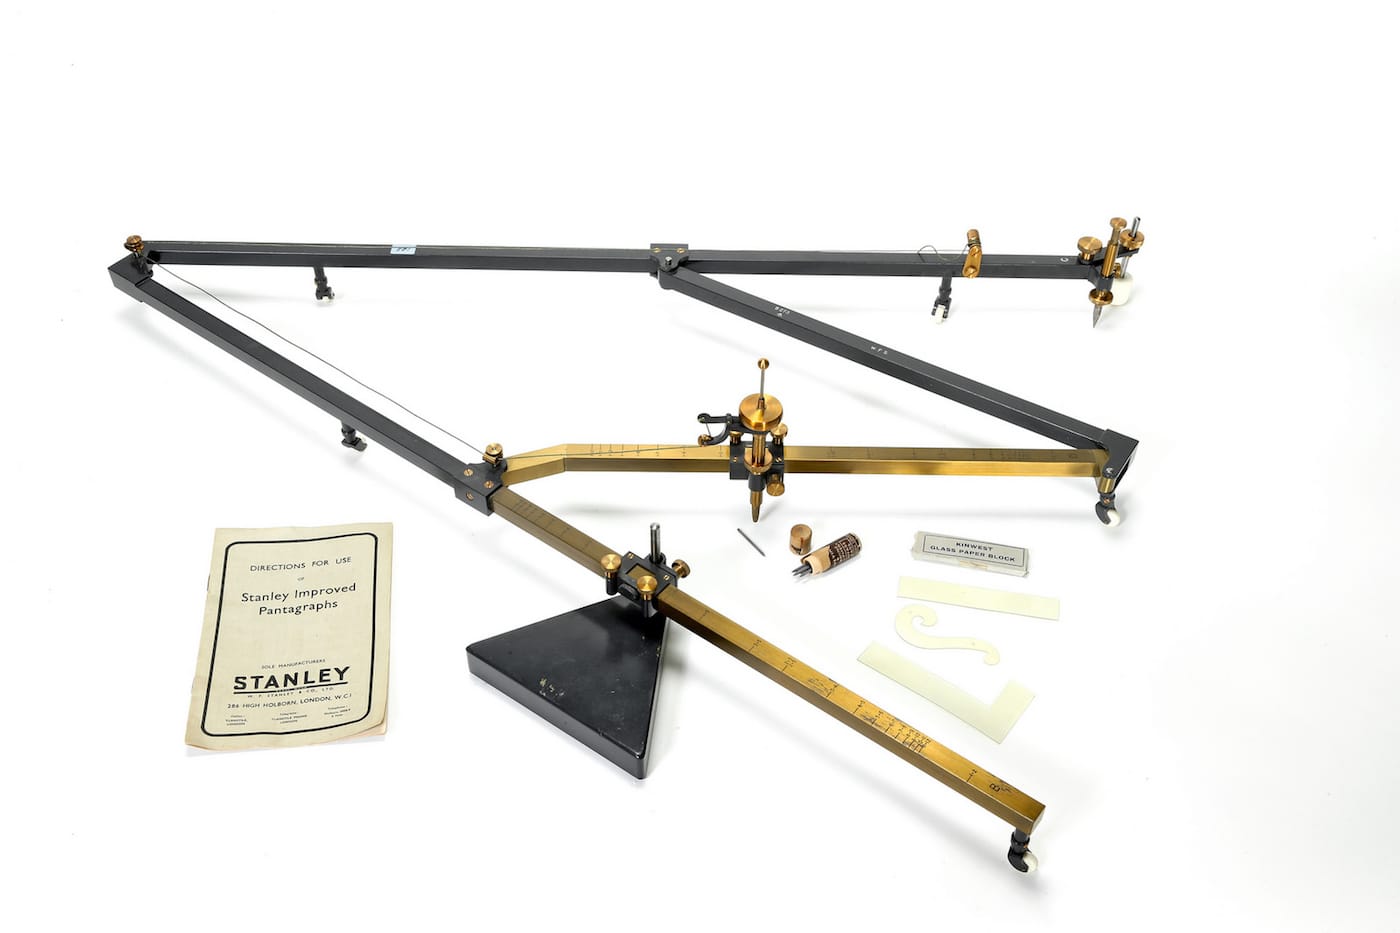
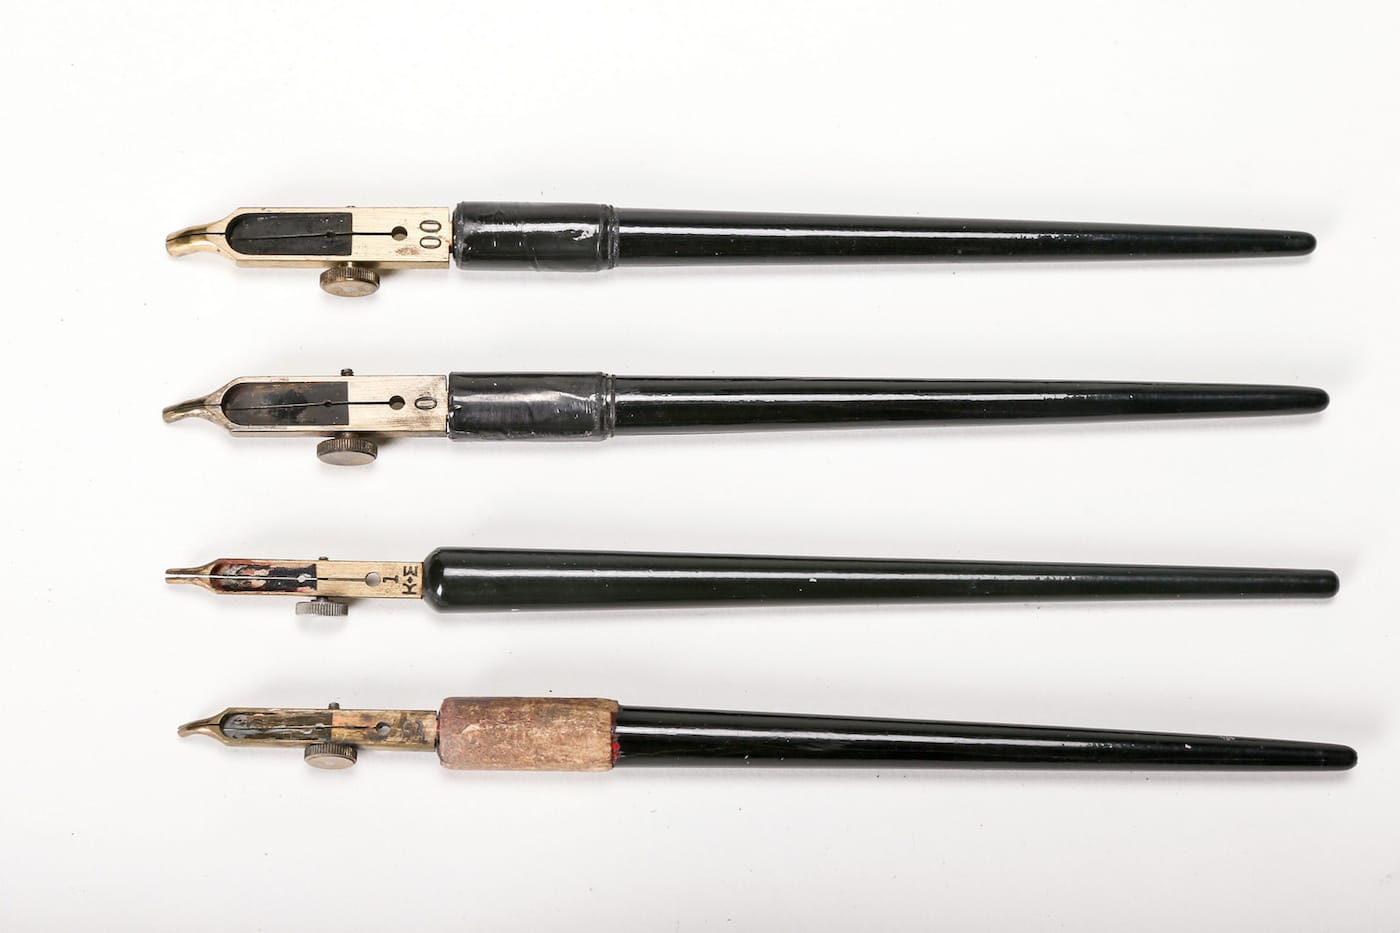
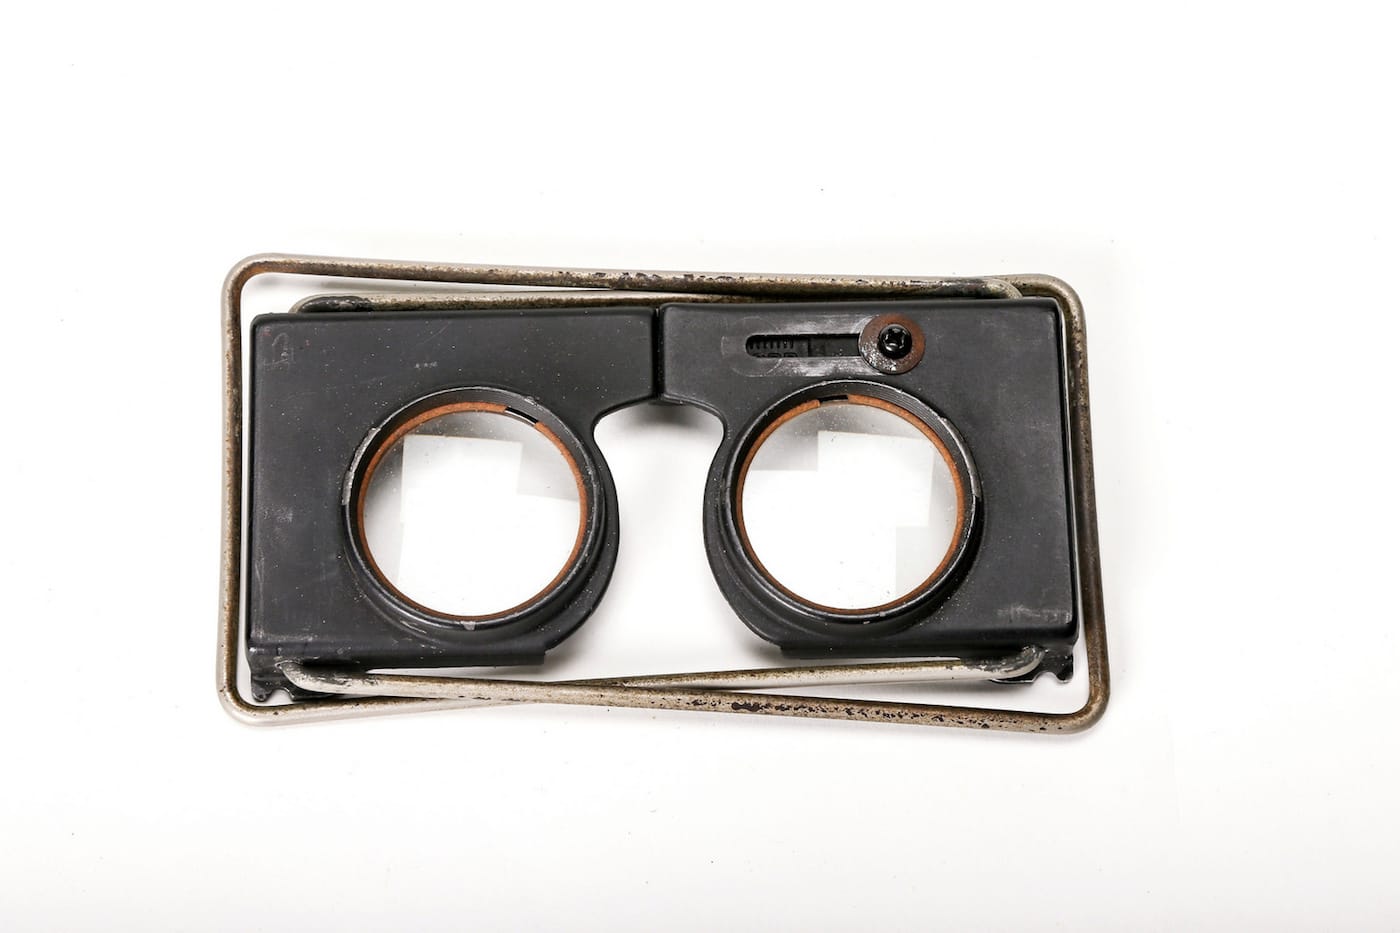
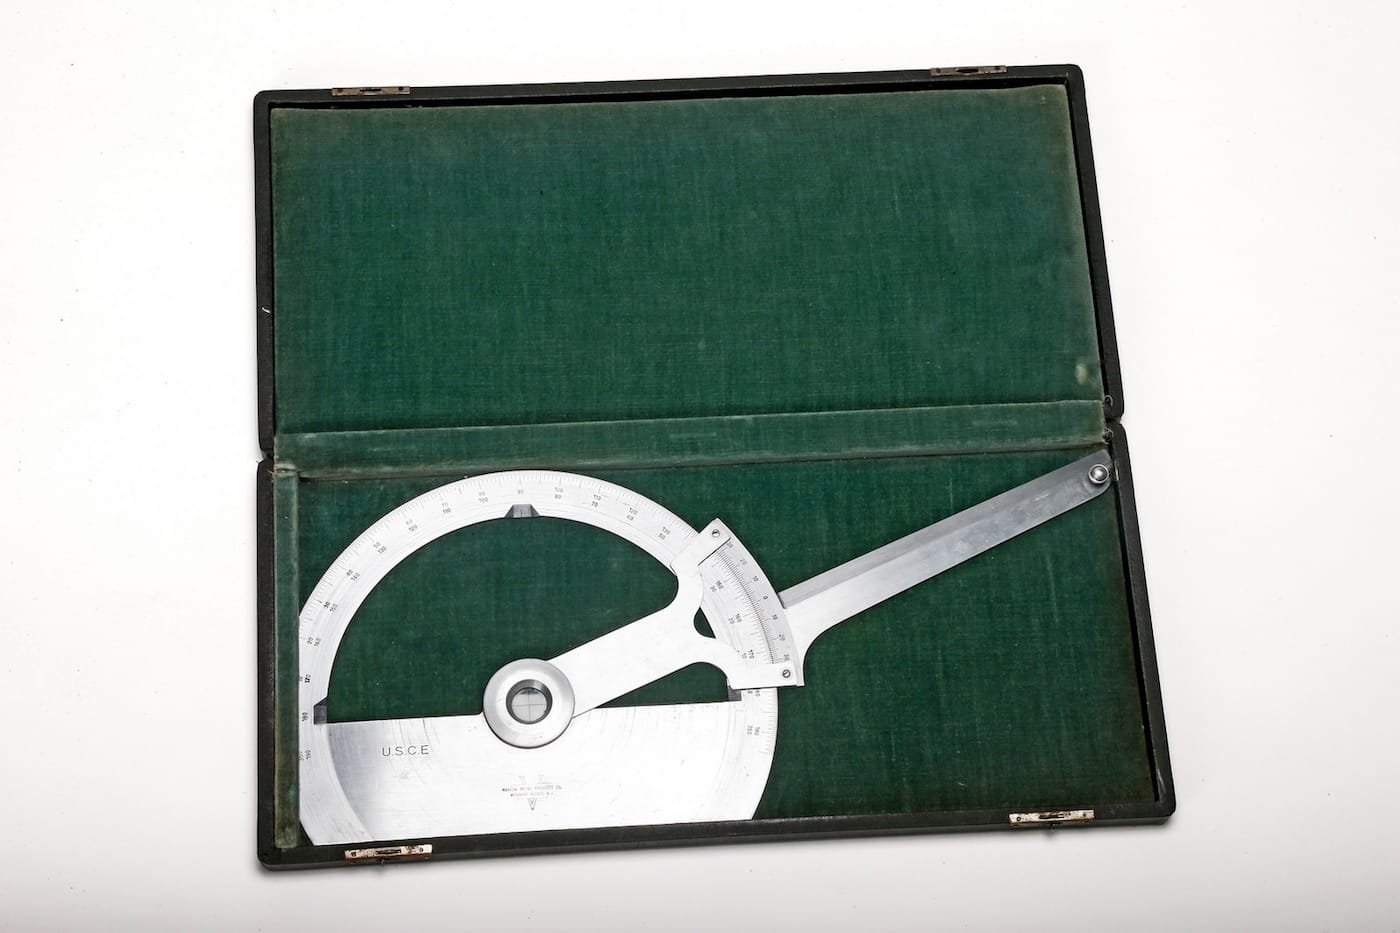
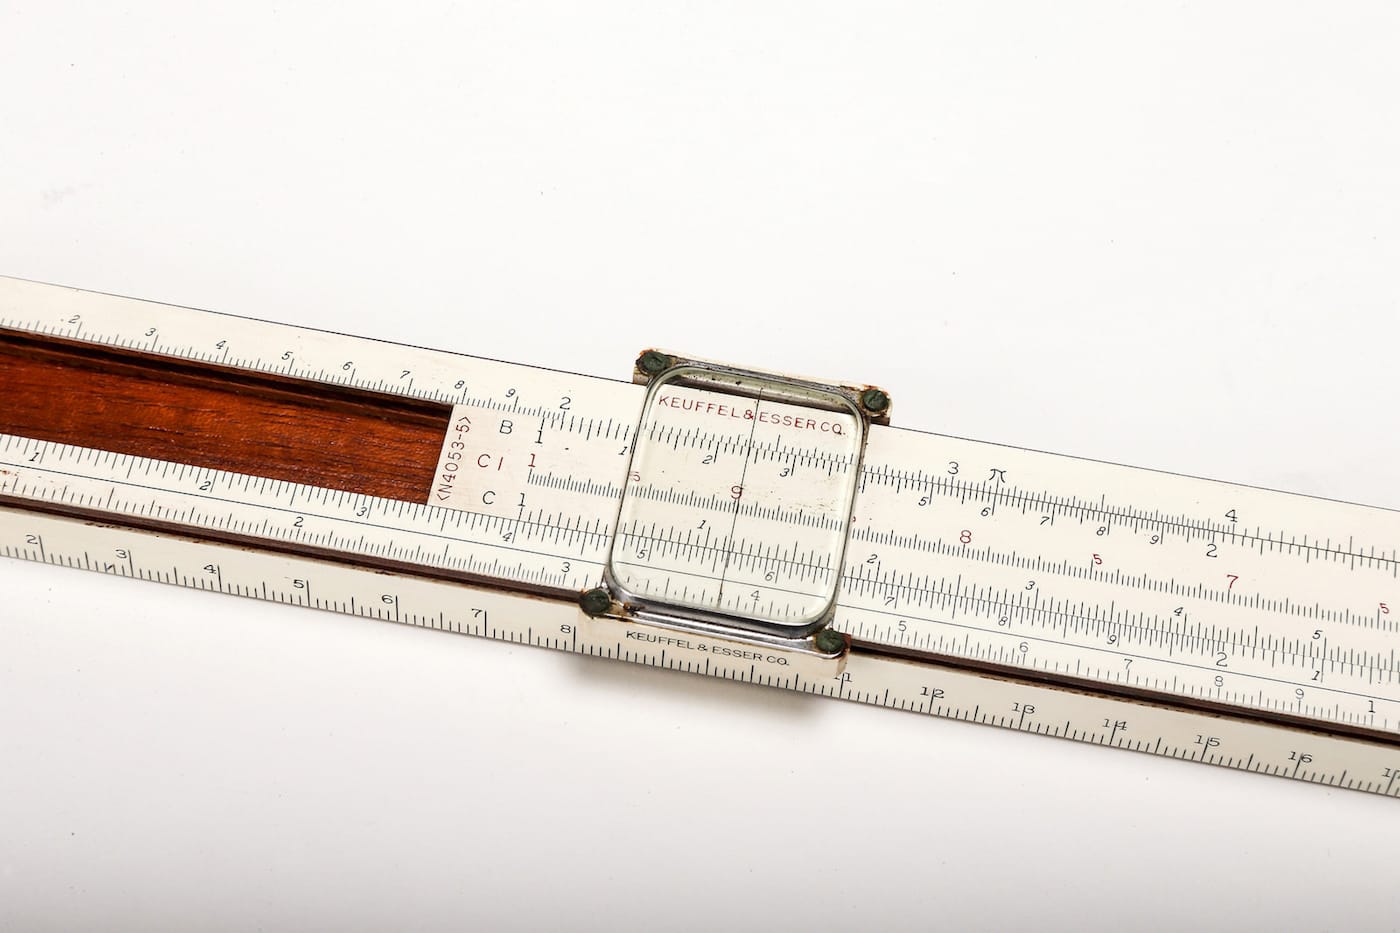
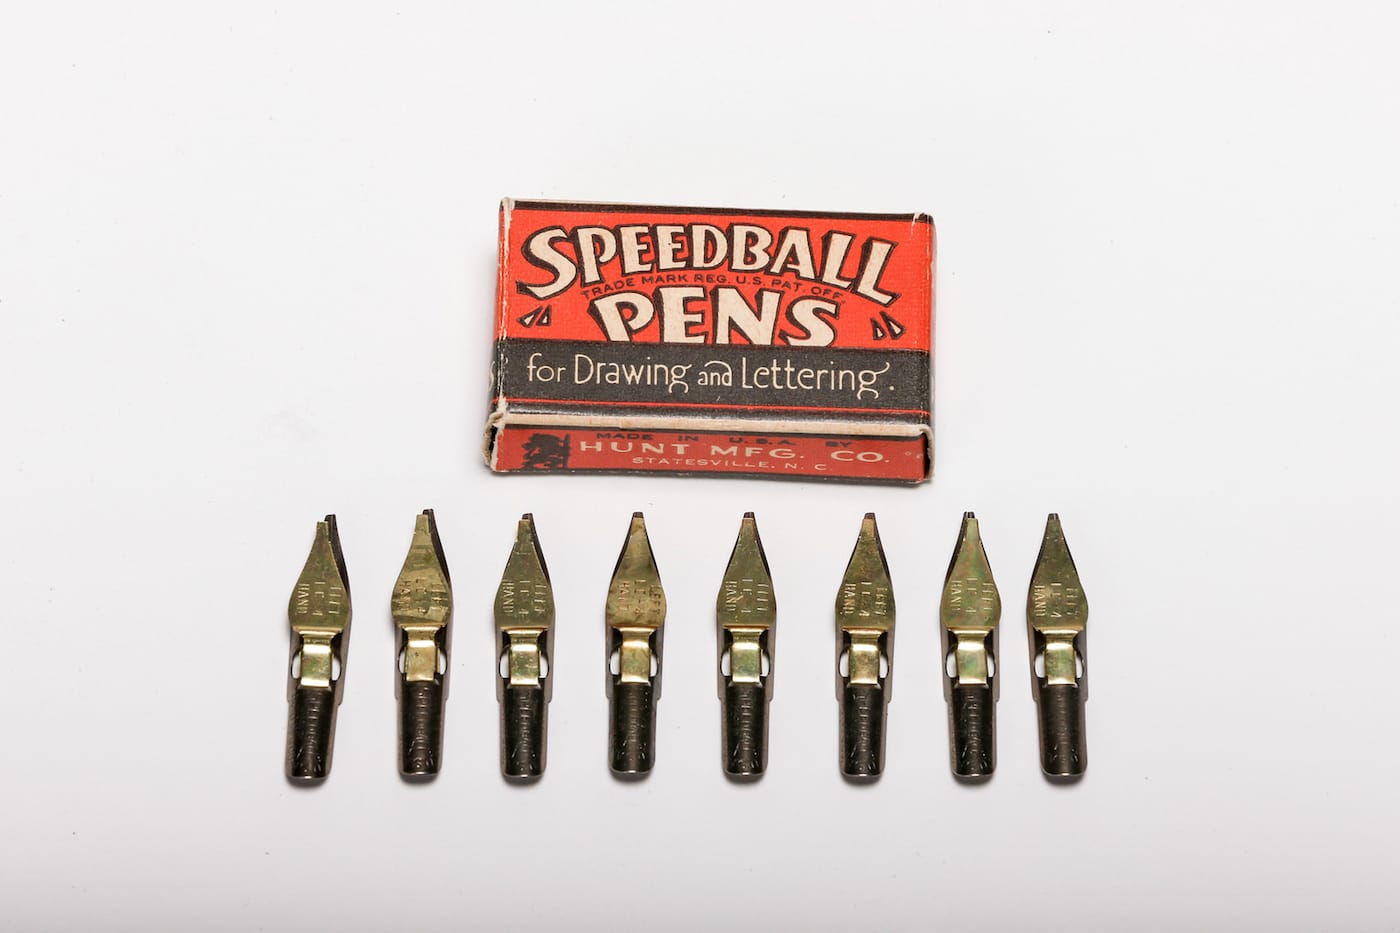
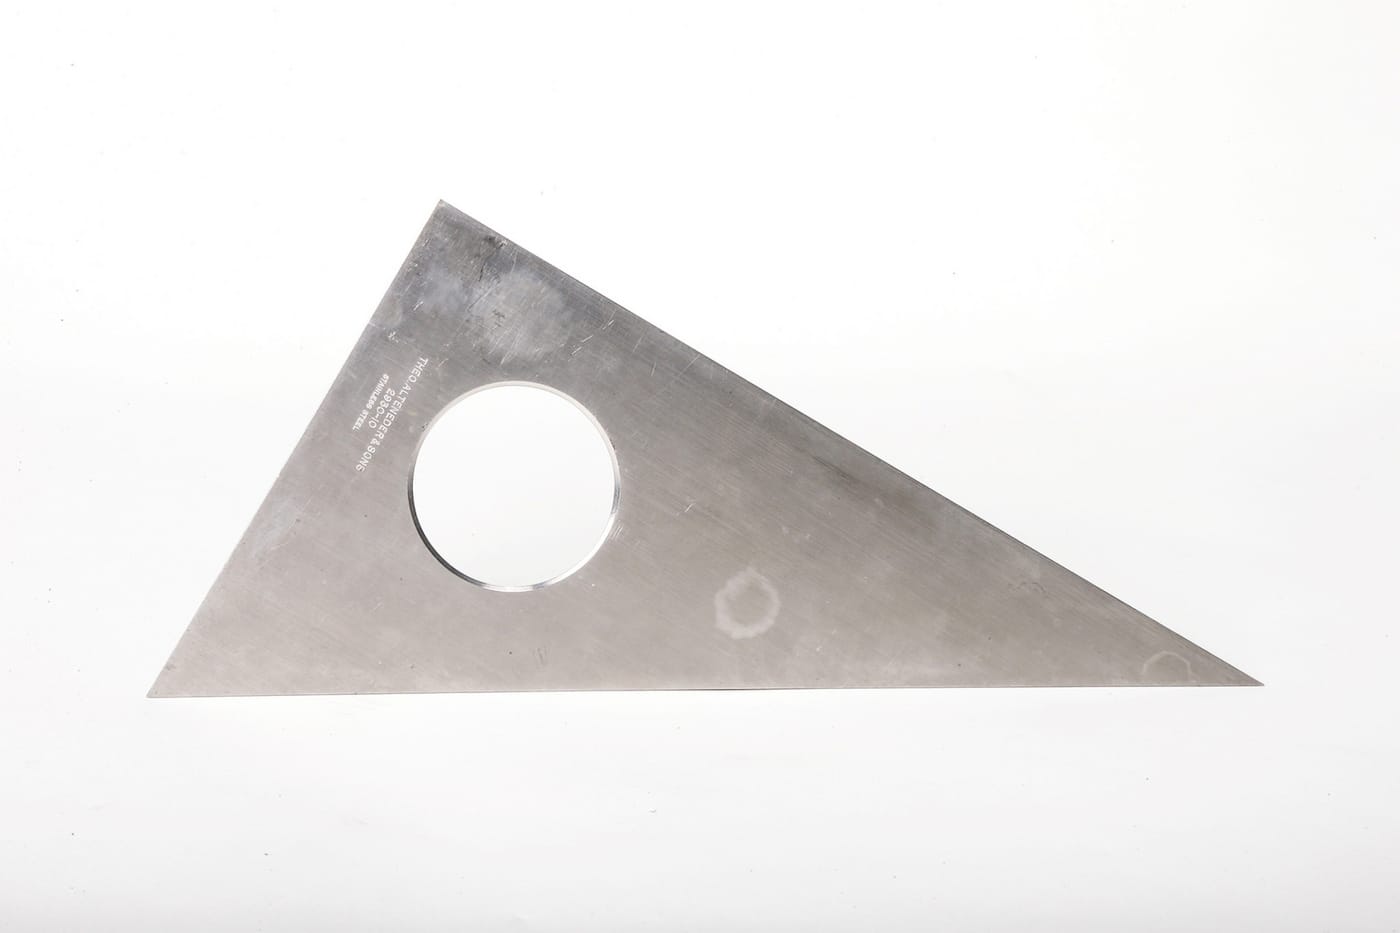
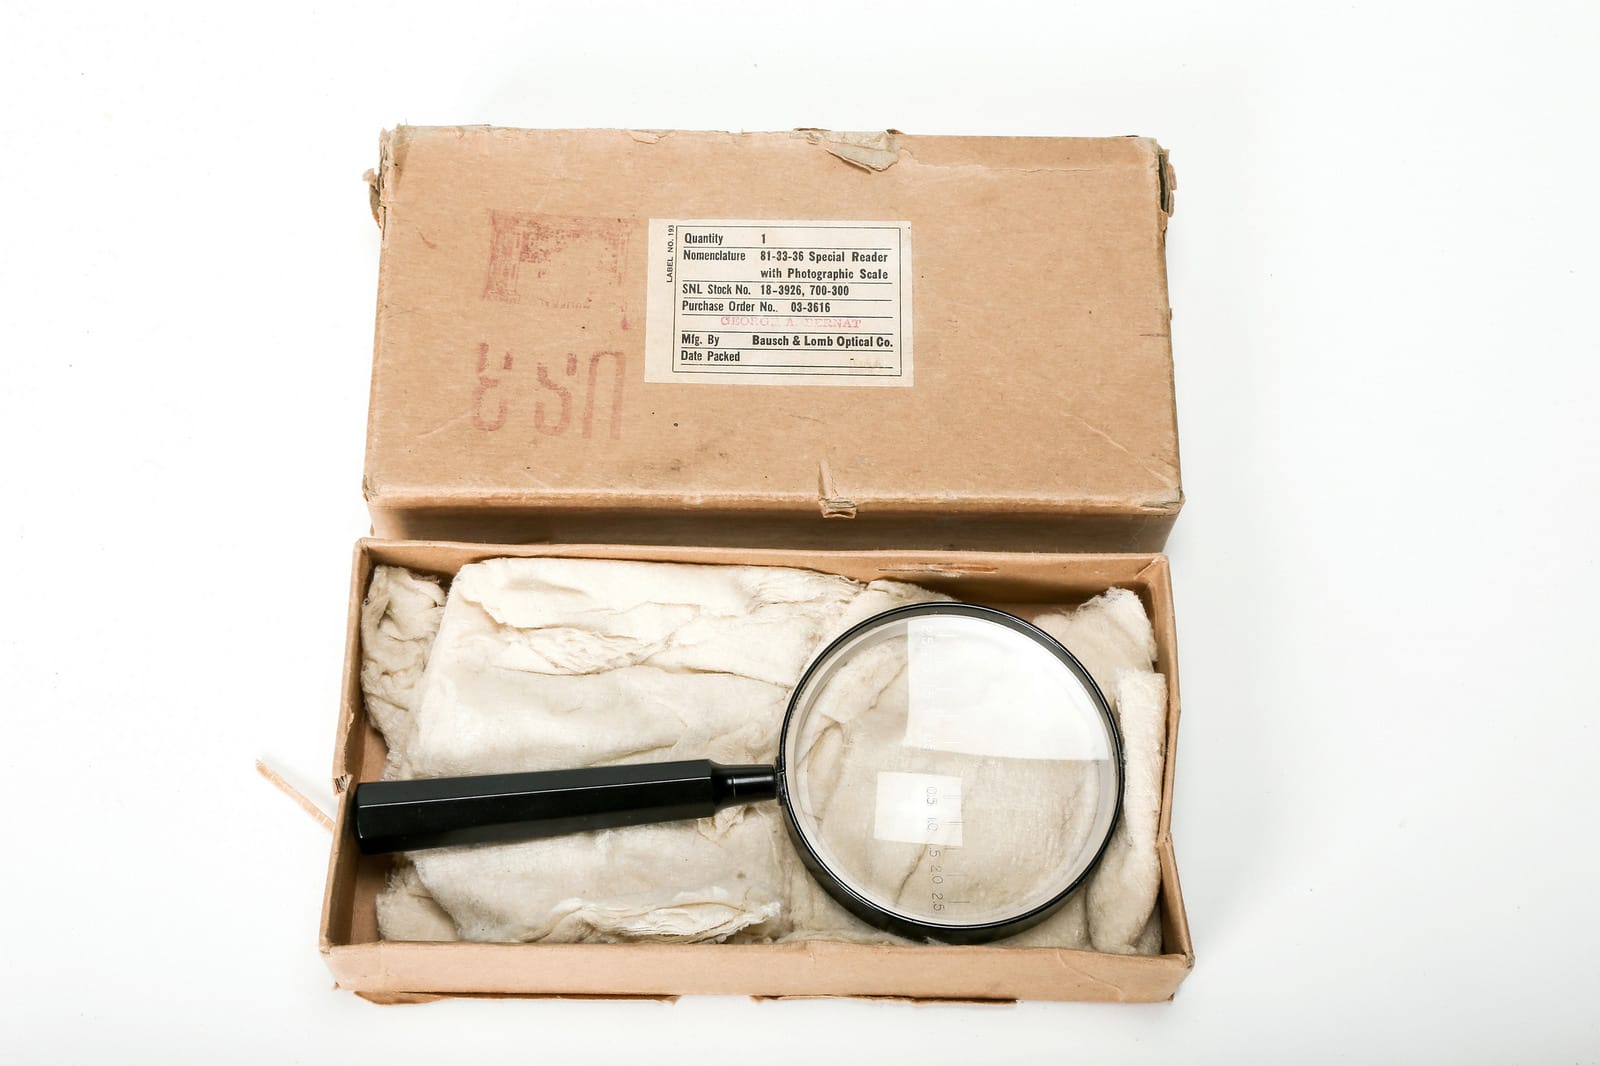
Below are some examples of the declassified CIA maps, along with cartography tool photographs that represent the early years when Office of Strategic Services (OSS) cartographers created their maps by hand.


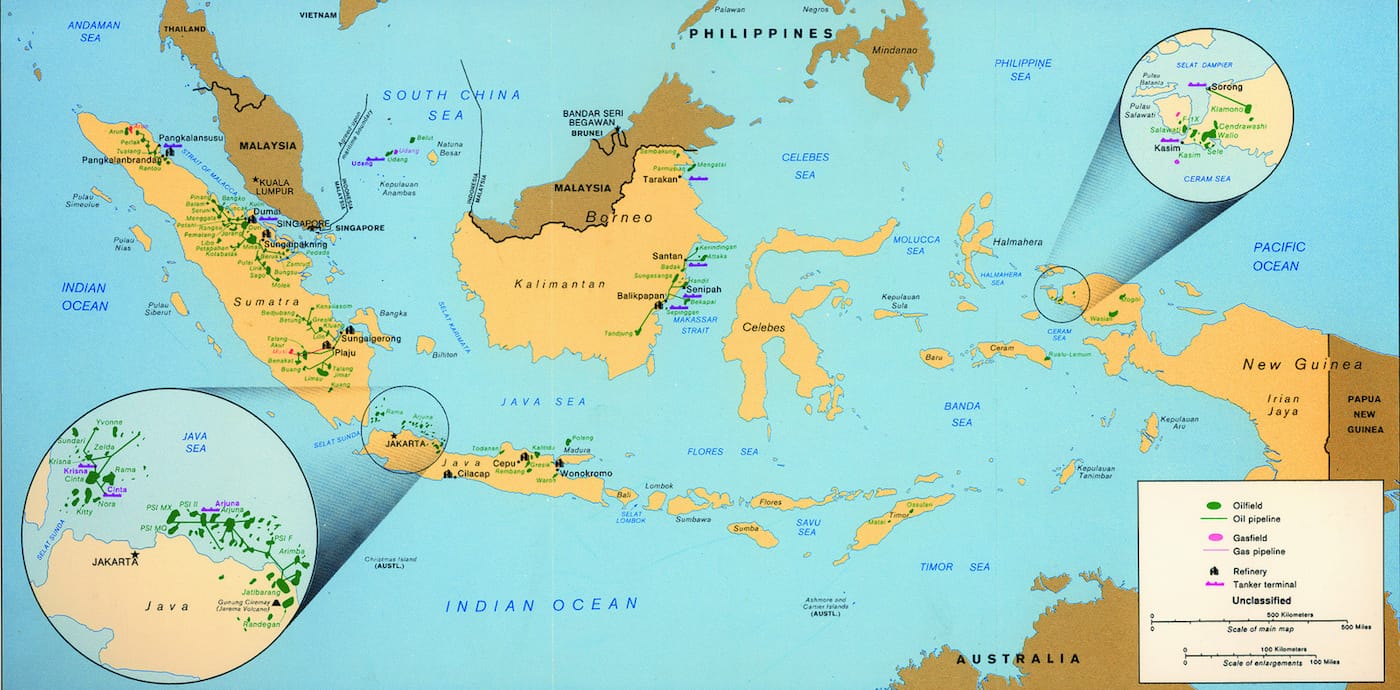
View more declassified maps from the CIA Cartography Center on Flickr.