Navigating Brooklyn from the 17th to the 21st Centuries
Brooklyn has long touted its status as the unofficial fourth largest city in the United States, if not for the so-called "great mistake of 1898" — the consolidation of New York City.

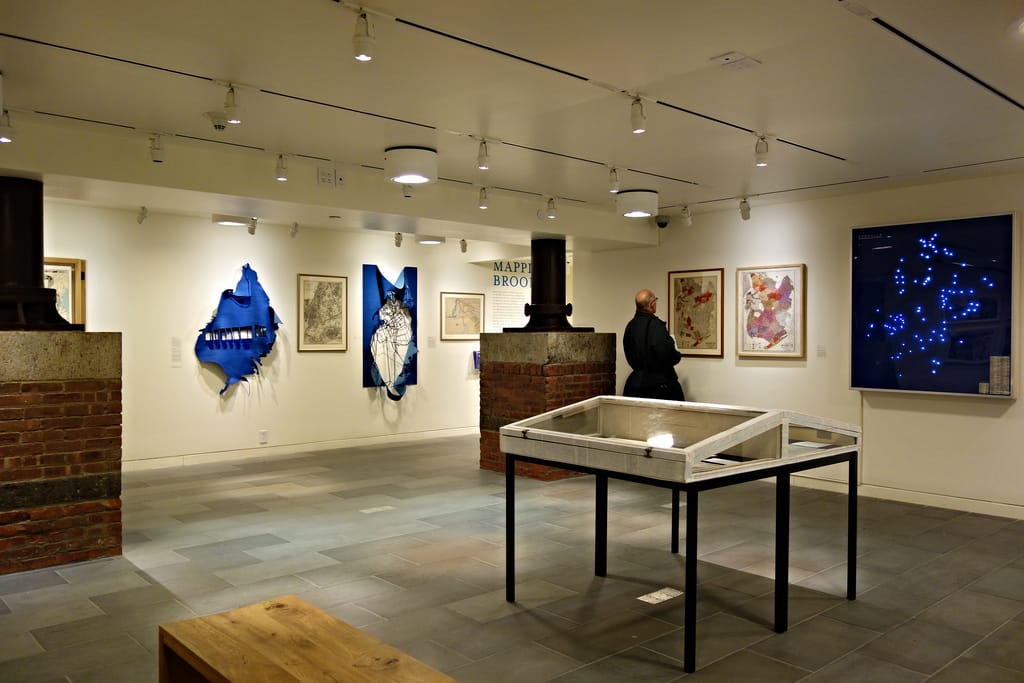
Brooklyn has long touted its status as the unofficial fourth largest city in the United States, if not for the so-called “great mistake of 1898” — the consolidation of New York City. An exhibition co-presented by the Brooklyn Historical Society (BHS) and BRIC, Mapping Brooklyn, celebrates the borough’s distinctive population and topography in both contemporary art and archival material.
Mapping Brooklyn spans the lower level gallery at BHS in Brooklyn Heights and the larger gallery space at the BRIC House in Fort Greene. Both installations feature pairings between each of the 18 contemporary artists and a map they selected from the BHS archives. (The work at BHS remains on view through September, while the BRIC portion of the show closes in early May.)
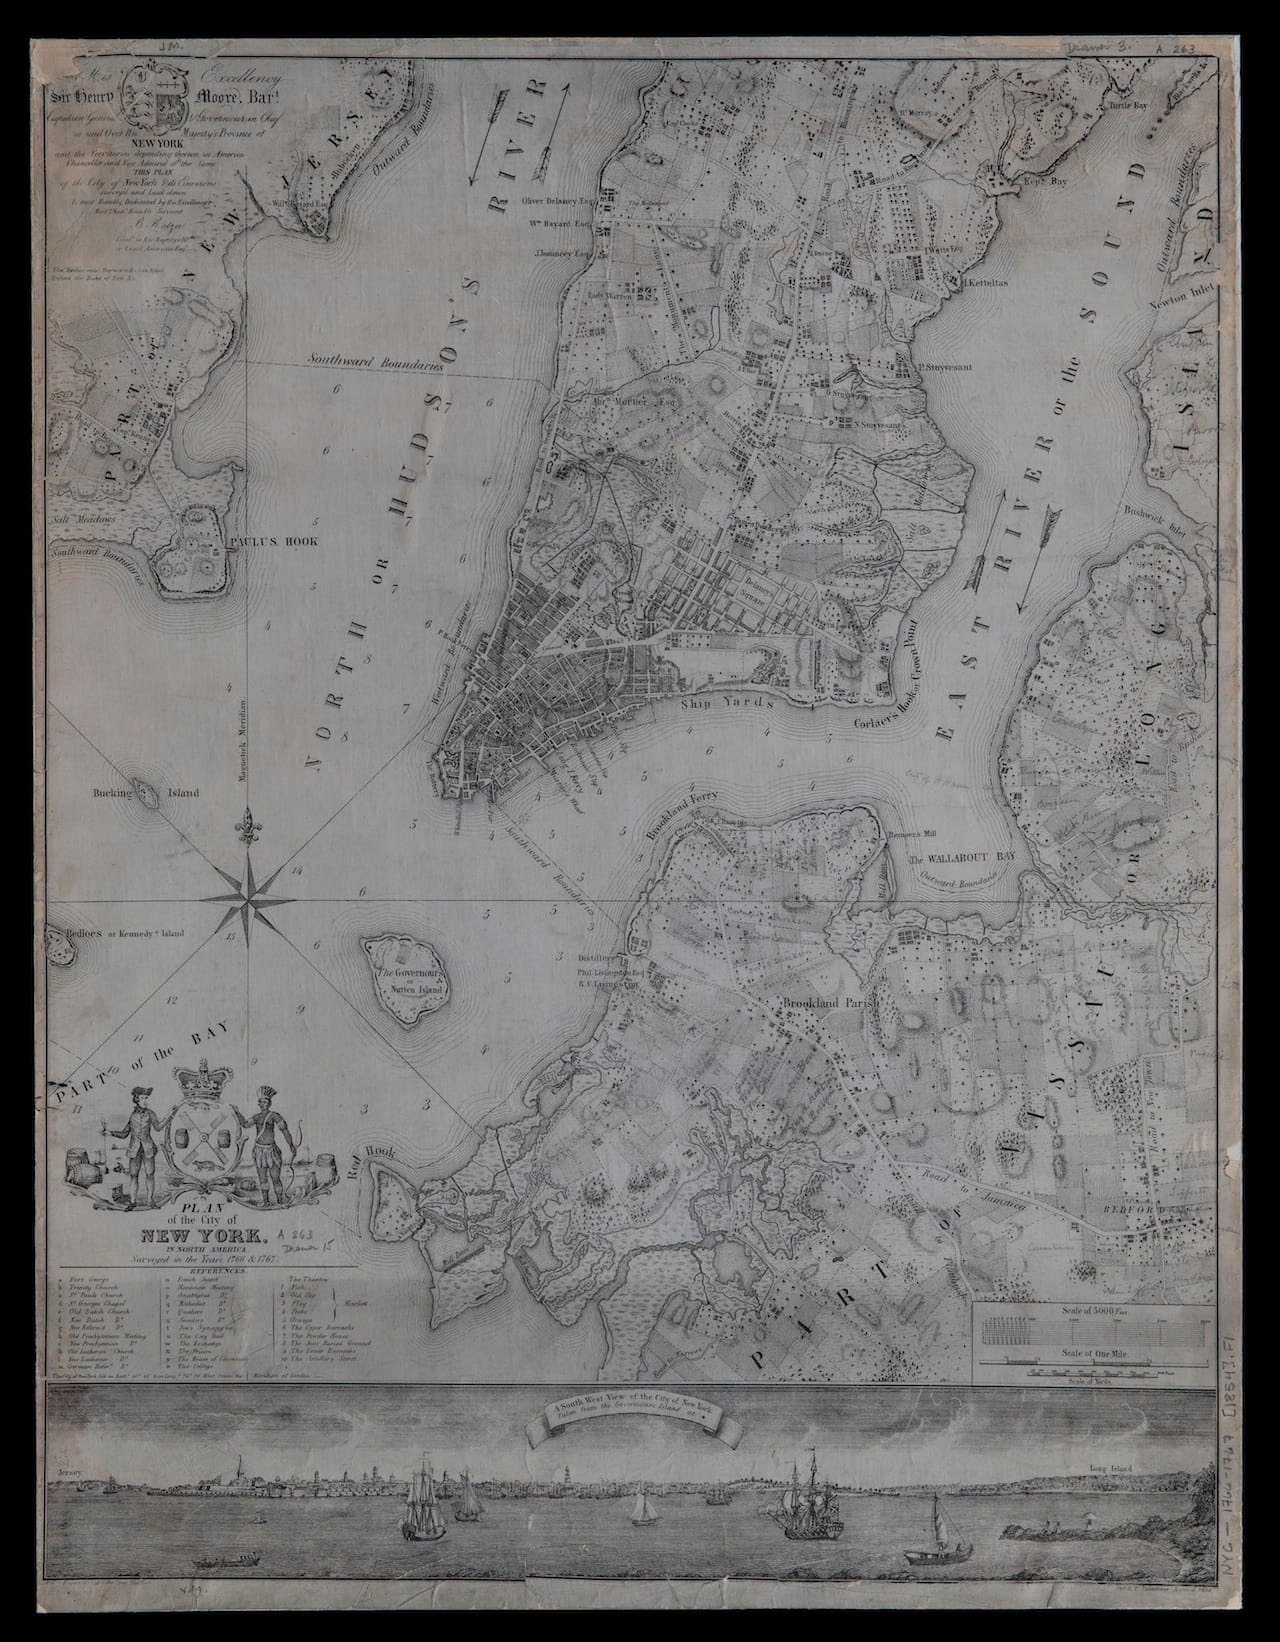
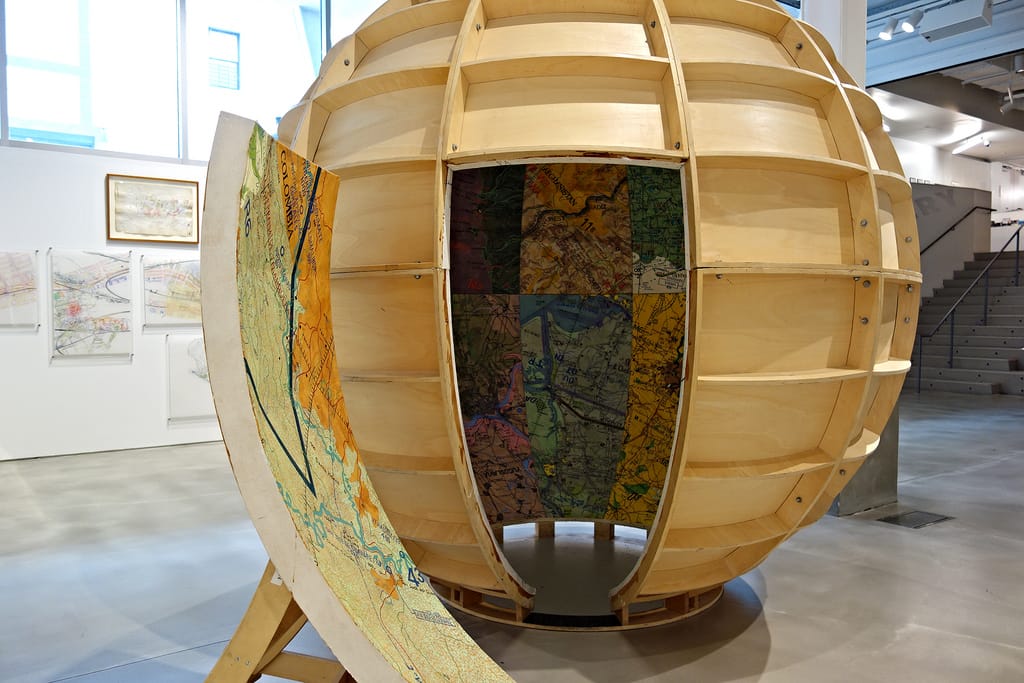
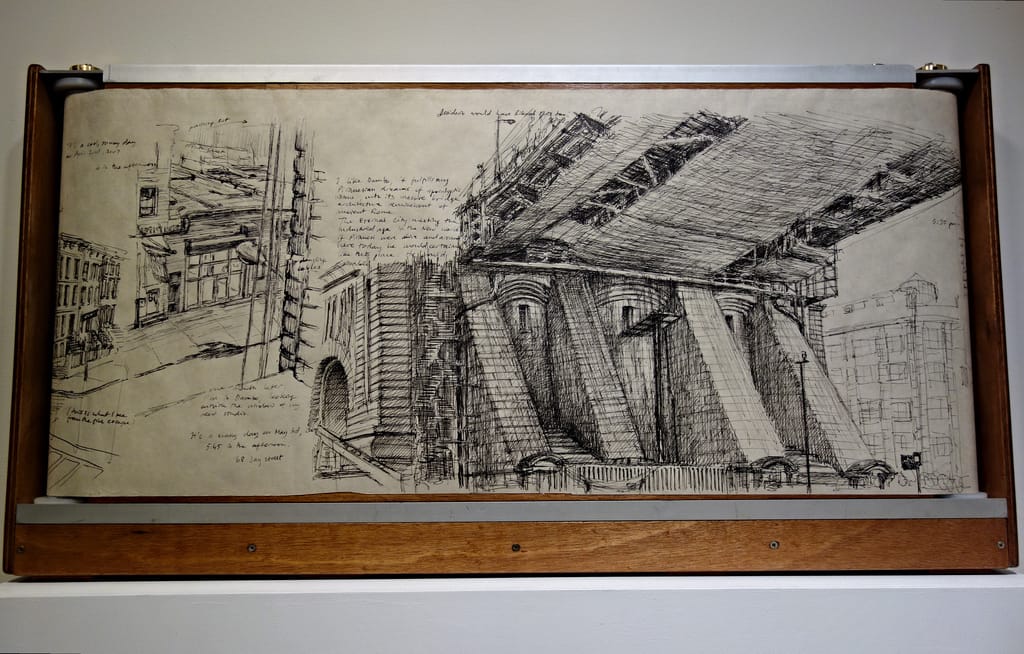
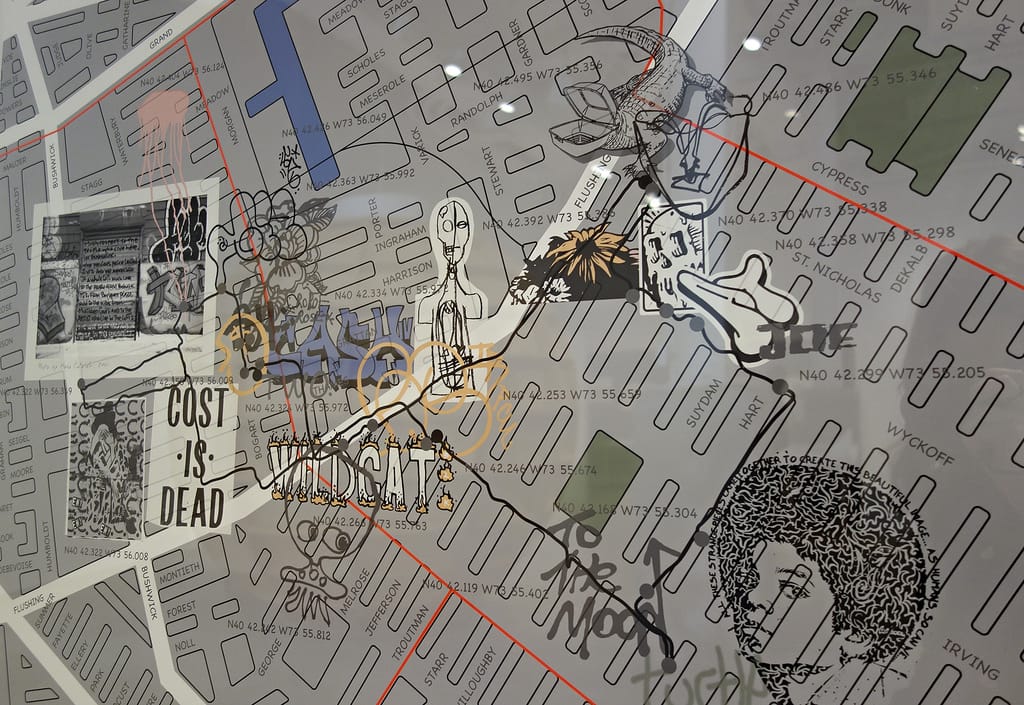
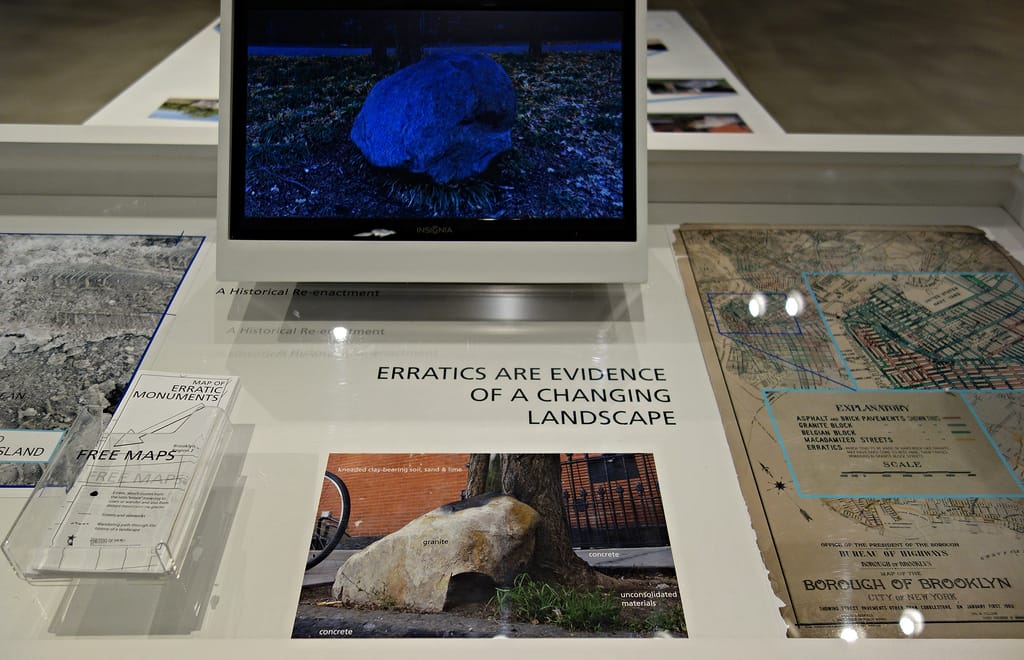
Mapping and cartography are incredibly broad as subjects, so the work, curated by vice-president of contemporary art at BRIC Elizabeth Ferrer, is all over in terms of what it plots across Brooklyn’s more than 70 square miles. Katarina Jerinic’s “Visitor Center for Erratic Monuments, Brooklyn, Region 2” (2015) documents boulders left behind by a glacier some 15,000 years ago, often overlooked reminders of Brooklyn’s Pleistocene heritage. Jan Rothuizen’s “Brooklyn Journals: The Distance from a point to a line in time” are illustrated and written chronicles of his movement through modern Brooklyn influenced by the 1670s travels in the area by Dutch explorer Jasper Danckaerts, whose writings are at BHS. Jennifer Maravillas created a 10-by-10-foot map out of litter picked up on the streets of Brooklyn that dominates one wall of BRIC House with colorful bits of gum wrappers, lottery tickets, and receipts. Curiously, the most visually striking work of the show — Joyce Kozloff’s 2000 “Targets,” a large sphere you can walk into at BRIC — responds to US military engagement by incorporating aerial maps of bombings, and is not about Brooklyn at all.
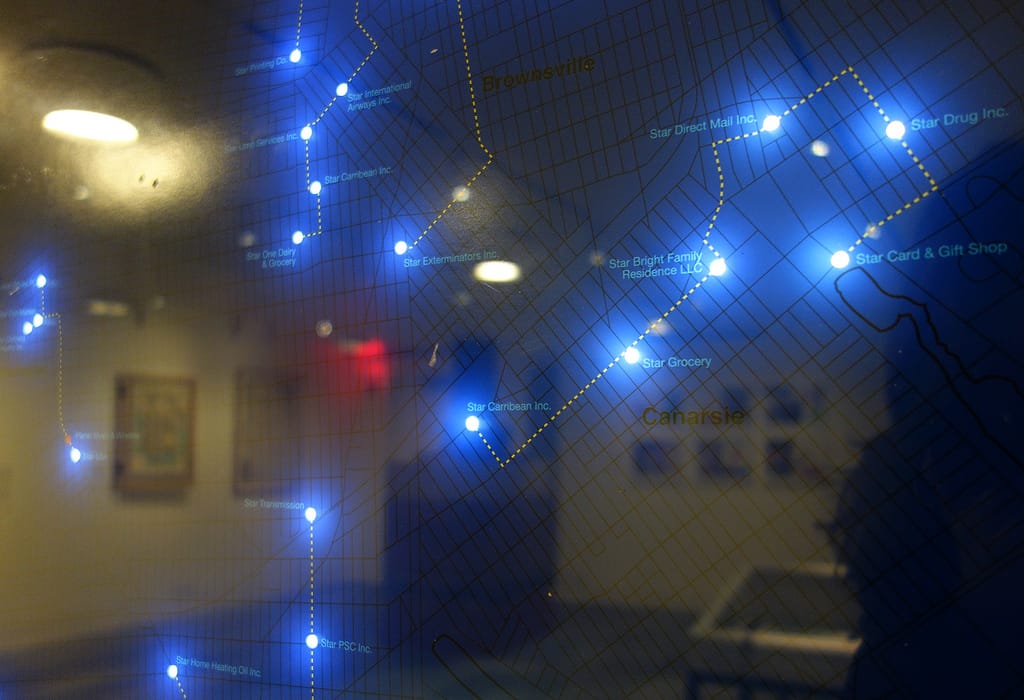
Other featured maps are more about sociology and visualizing data, like Laura Kurgan’s “Million Dollar Blocks.” Created with the Spatial Information Design Lab at Columbia University, the project tabulates incarceration statistics in five major cities, concentrating in Mapping Brooklyn on Brownsville. Though it is one of Brooklyn’s poorest neighborhoods, the US government spends over a million dollars to incarcerate people from several individual Brownsville blocks.
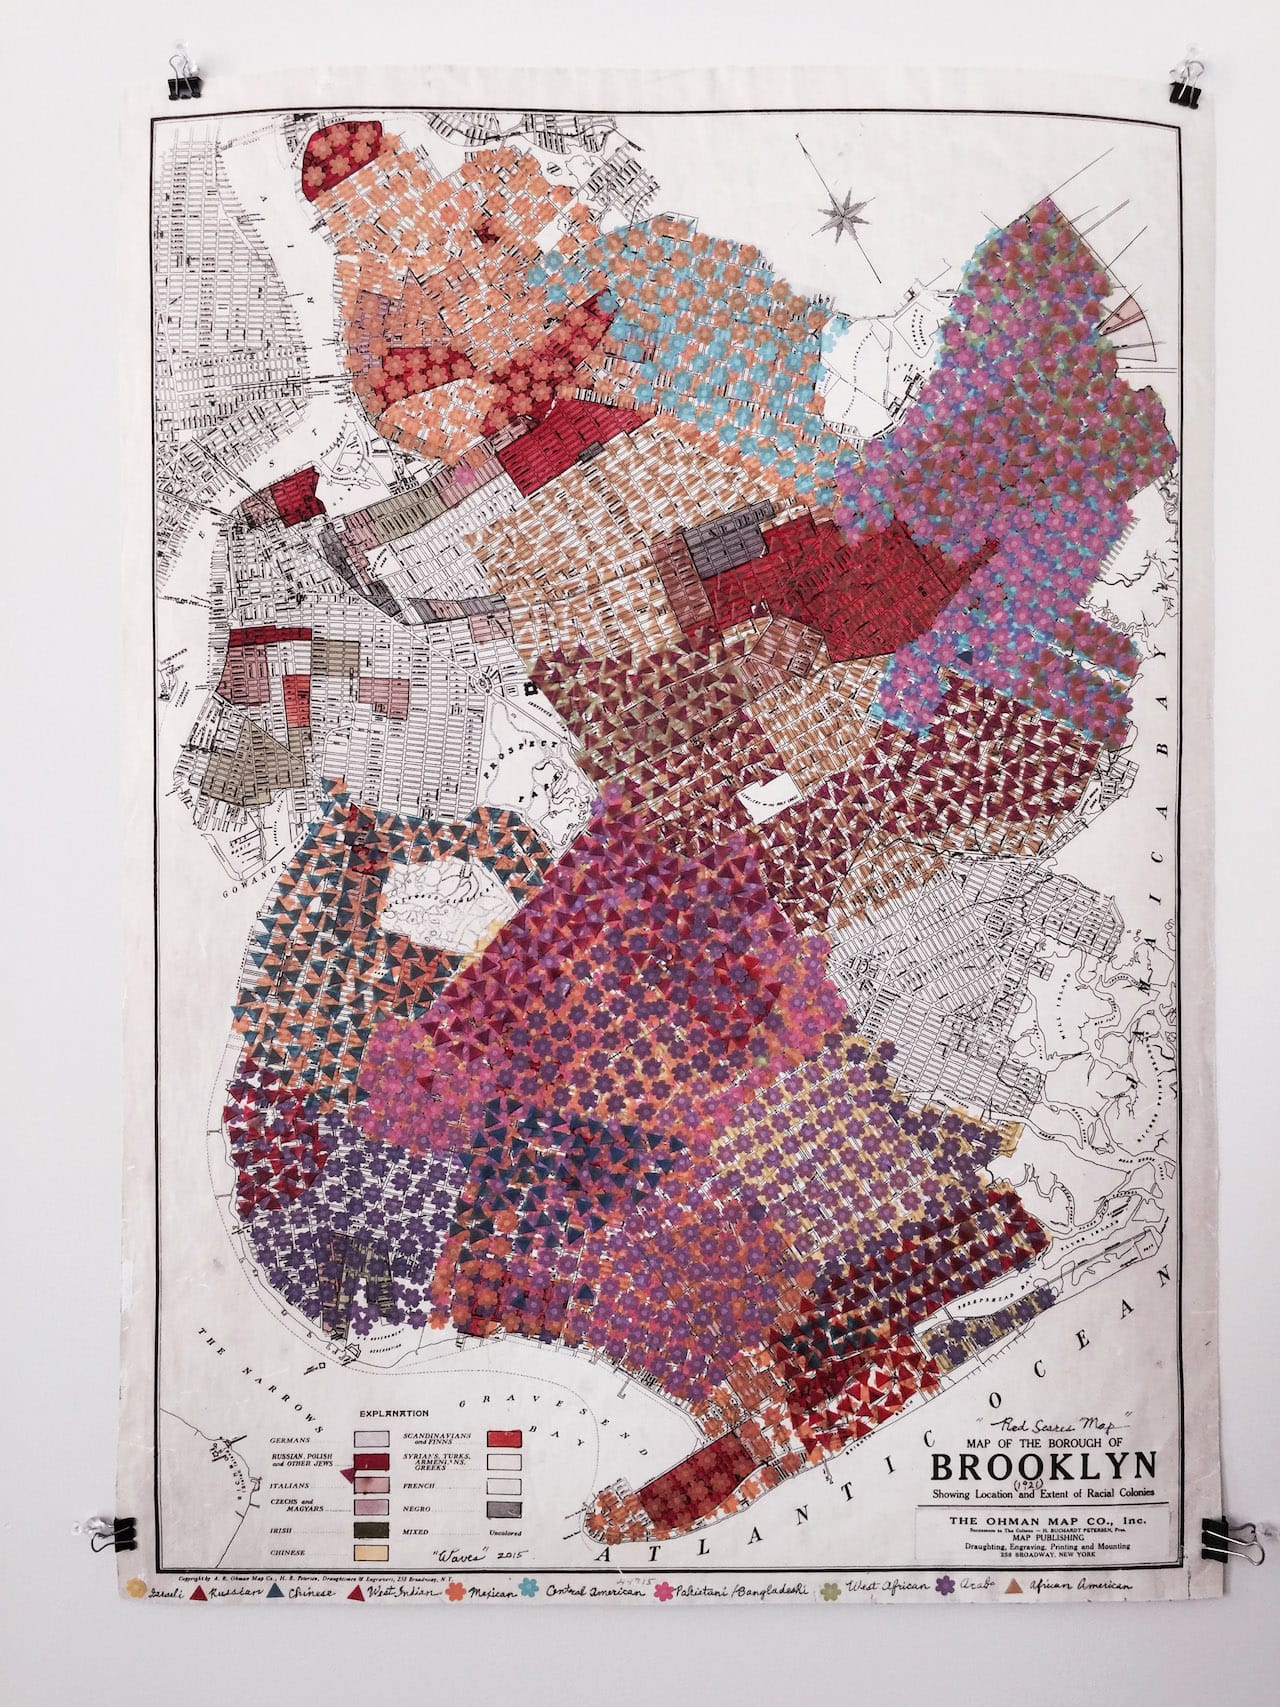
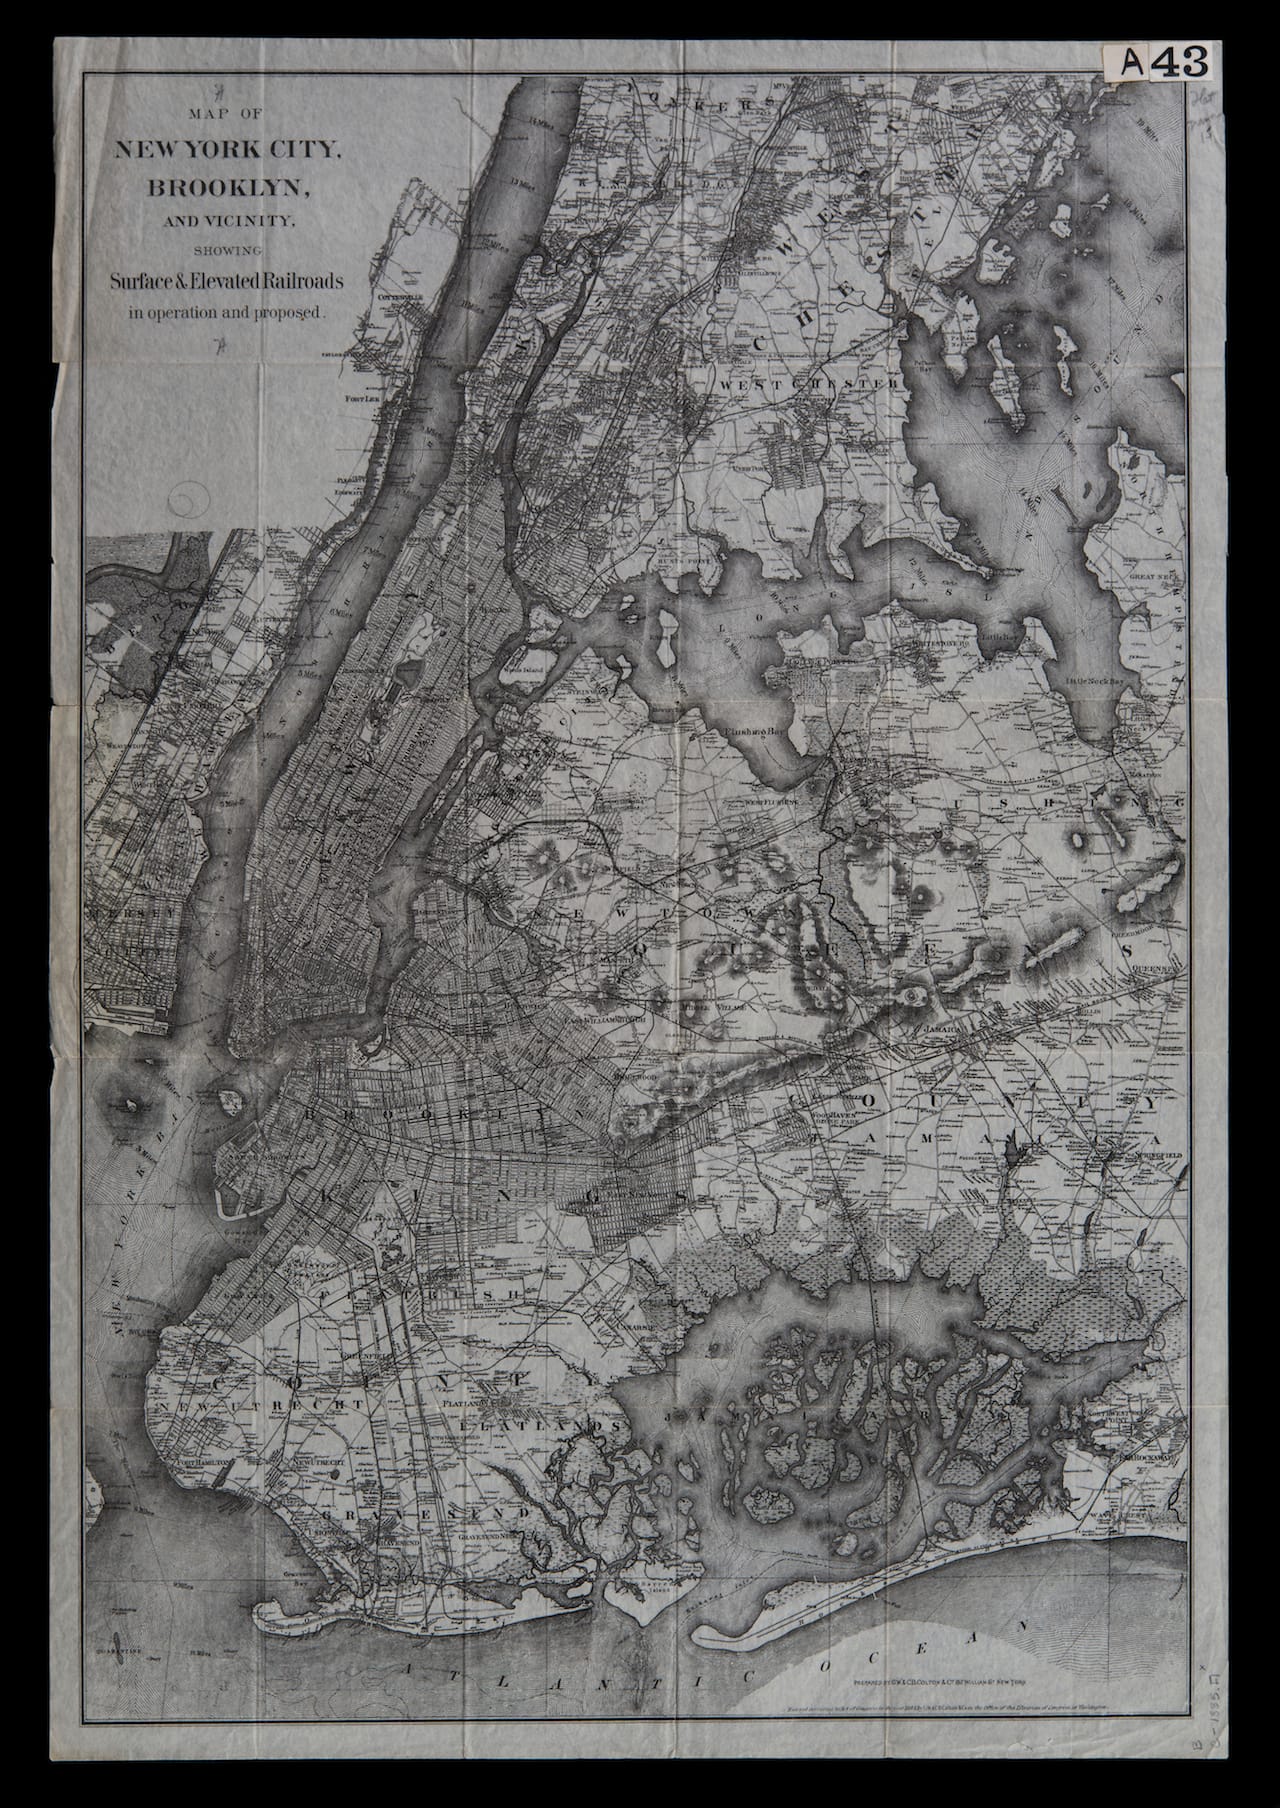
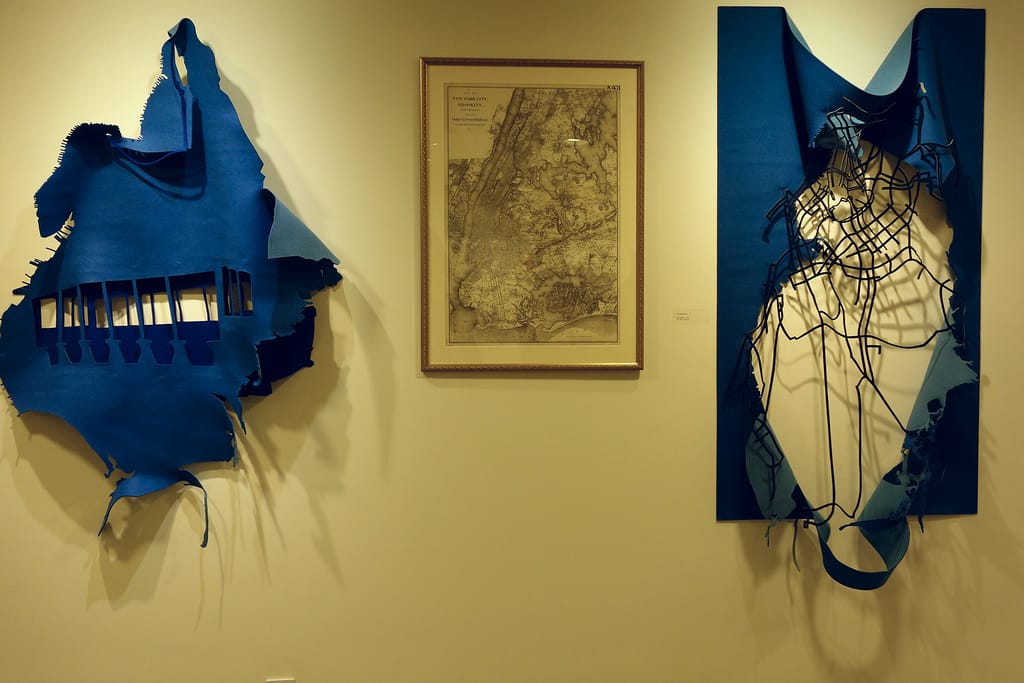
The historic maps, selected by participating contemporary artists, often feel detached in the exhibition and might have stood better as their own installation. Instead, the delicate and faded colors of property maps and 17th-century surveys mingle with contemporary art. There are some interesting connections, like Kozloff’s “Waves” covering a 1920 map, showing the “location and extent of racial colonies” from the Red Scare xenophobia, with colorful stickers representing the subsequent waves of immigration that made Brooklyn the city-size borough it is today.
![Paired with Kozloff: Map of the Borough of Brooklyn: Showing Location and Extent of Racial Colonies, Ohman Map Co., 1920; Flat Maps B B-[1920].fl; Brooklyn Historical Society.](https://storage.ghost.io/c/51/f8/51f871d8-b6be-4a73-b958-0ca4fff0110a/content/images/hyperallergic-newspack-s3-amazonaws-com/uploads/2015/02/mappingbrooklyn20.jpg)

Mapping Brooklyn continues at BRIC House (647 Fulton Street, Fort Greene, Brooklyn) through May 3, and Brooklyn Historical Society (128 Pierrepont Street, Brooklyn Heights, Brooklyn) through September 6.